Site Analysis
In this section, you will learn how to create a site analysis by documenting observed features of a property using digital tools. Specifically, you will discover how to utilise spot, area, directional, and corridor markers to highlight various site characteristics and how to employ the Sun Tool to understand solar movement for design considerations.
What is Site Analysis?
In site analysis, we note down observed features of the land. We use Markers and the Sun Tool to do so.
Video: Drawing Site Analysis
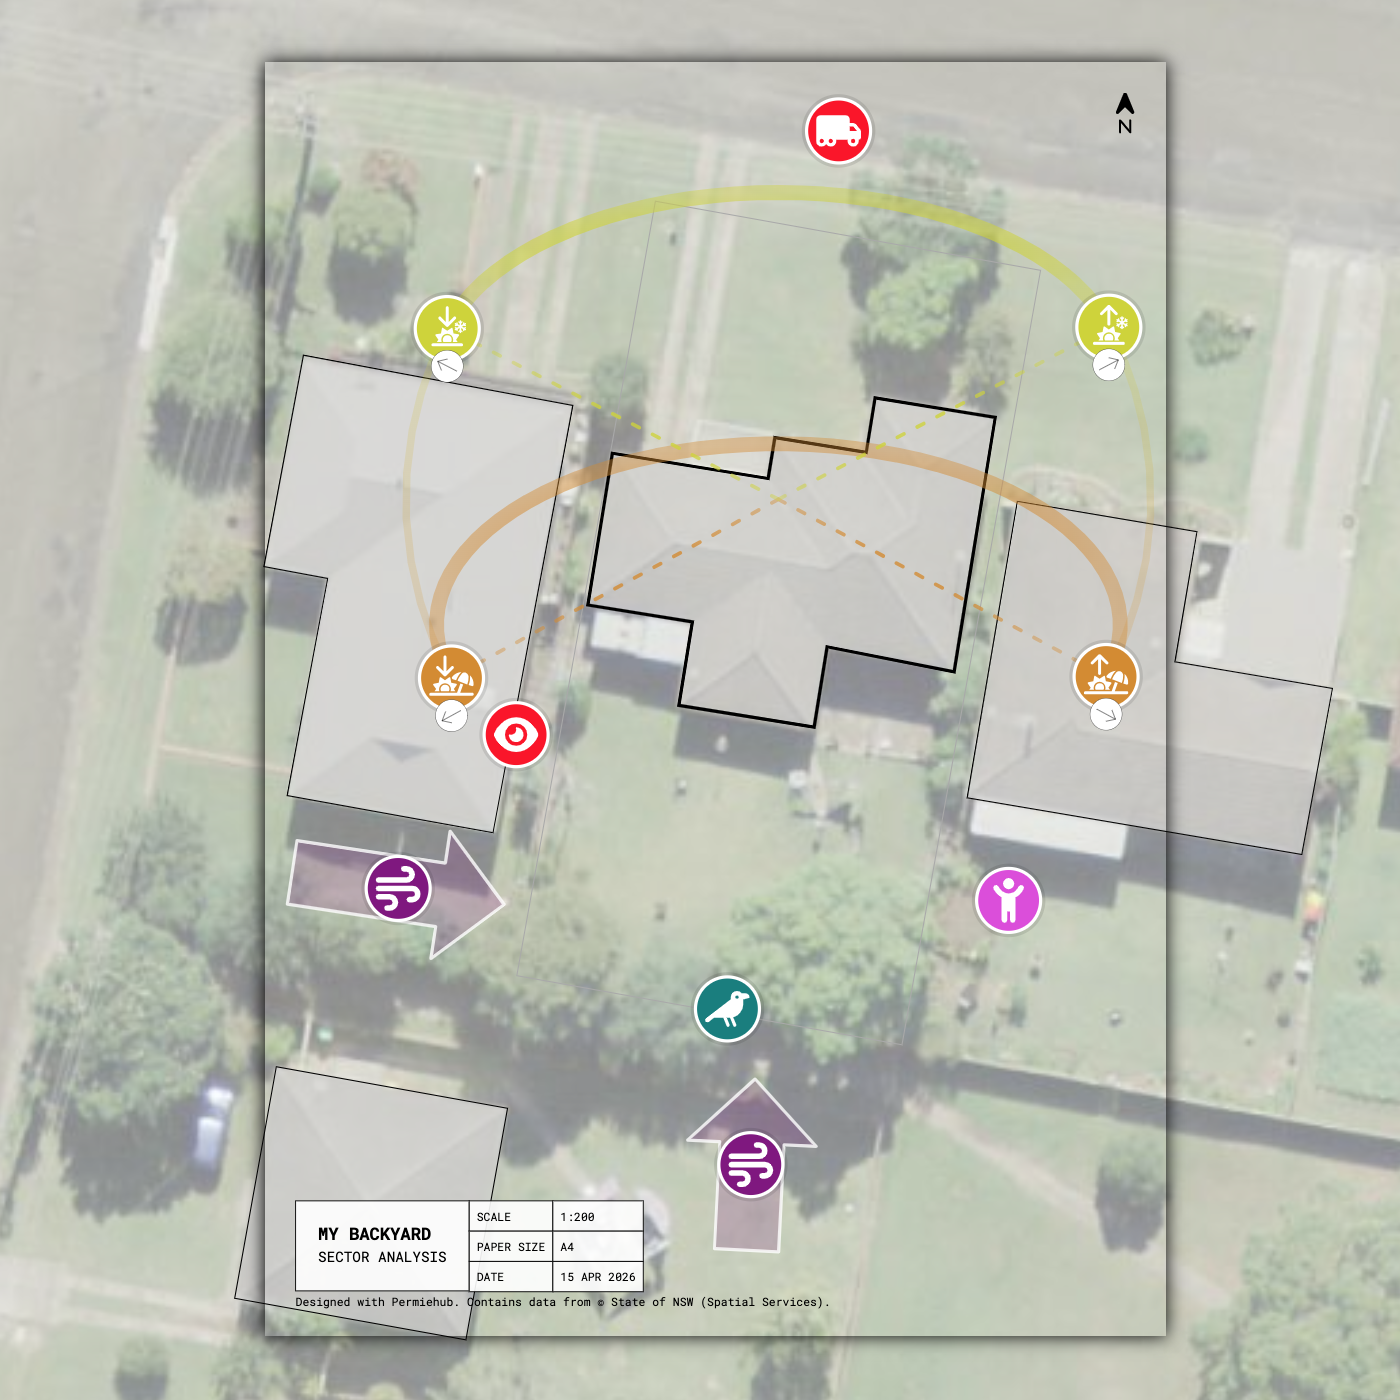
We recommend starting with the following video, which shows how you can create a site analysis drawing in Permiehub using its Sun Tool and Markers.
In the Site Analysis Video
- 0:00 - Sun Path
- 0:25 - Prevailing Winds
- 0:48 - Adding Markers
- 1:10 - Labelling Markers
- 1:34 - Mapping Sun Exposure
Markers
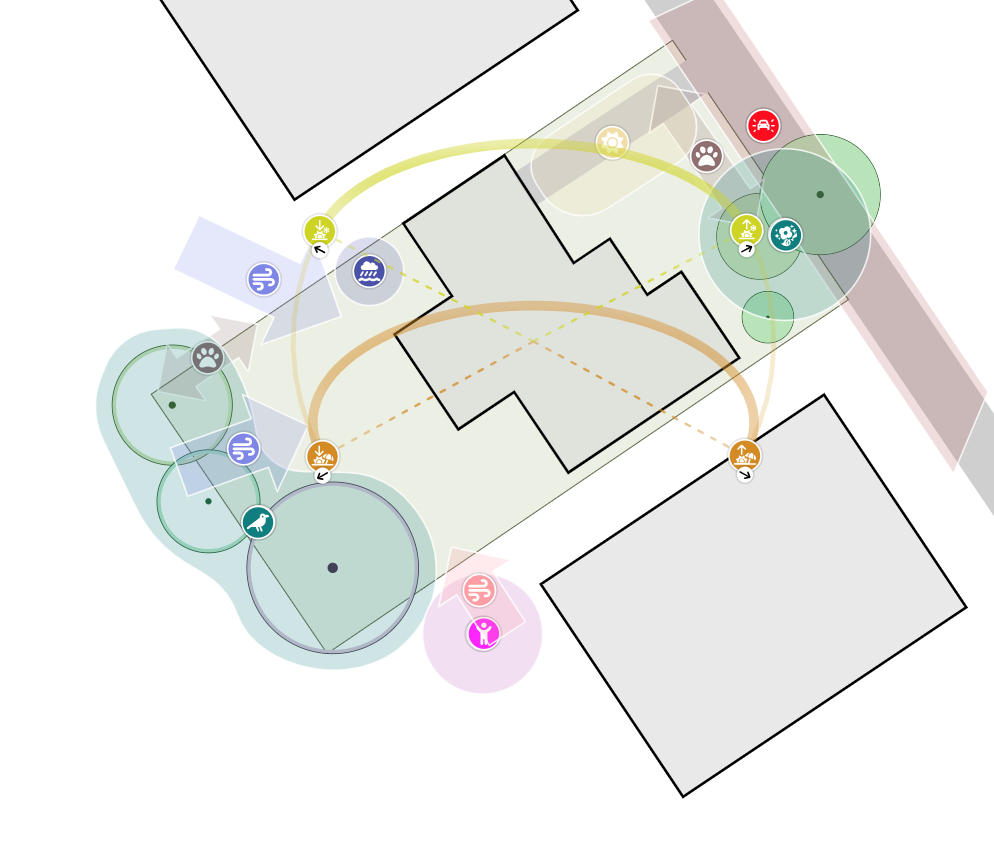
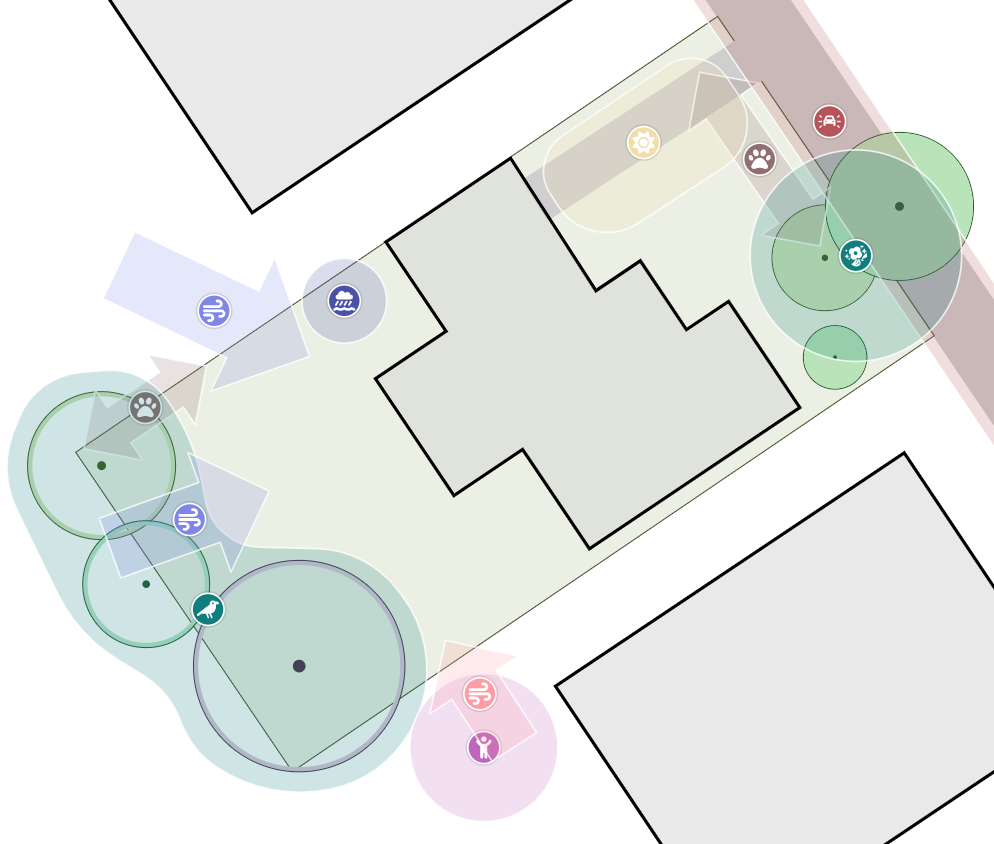
Markers allow you to highlight and record key observations on the property to address later during design work. Permiehub organises site analysis tools into practical categories, such as weather and elements, sun exposure, fauna and flora, human activity, and soil types. You can pick from a wide selection of presets in the toolbox, search by keyword, or browse through categories.
Changing the colour of a marker allows you to organise and colour-code your analysis, using categories that represent observations as negative, neutral, or positive.
To learn more about changing a marker’s size, name, shape, or label, jump to the drawing site analysis markers page.
Spot Markers
Spot markers mark out a specific point on the land using a designated icon or symbol. If you observe an element that covers a larger zone, consider using an area marker instead.
Example of Using Spot Markers
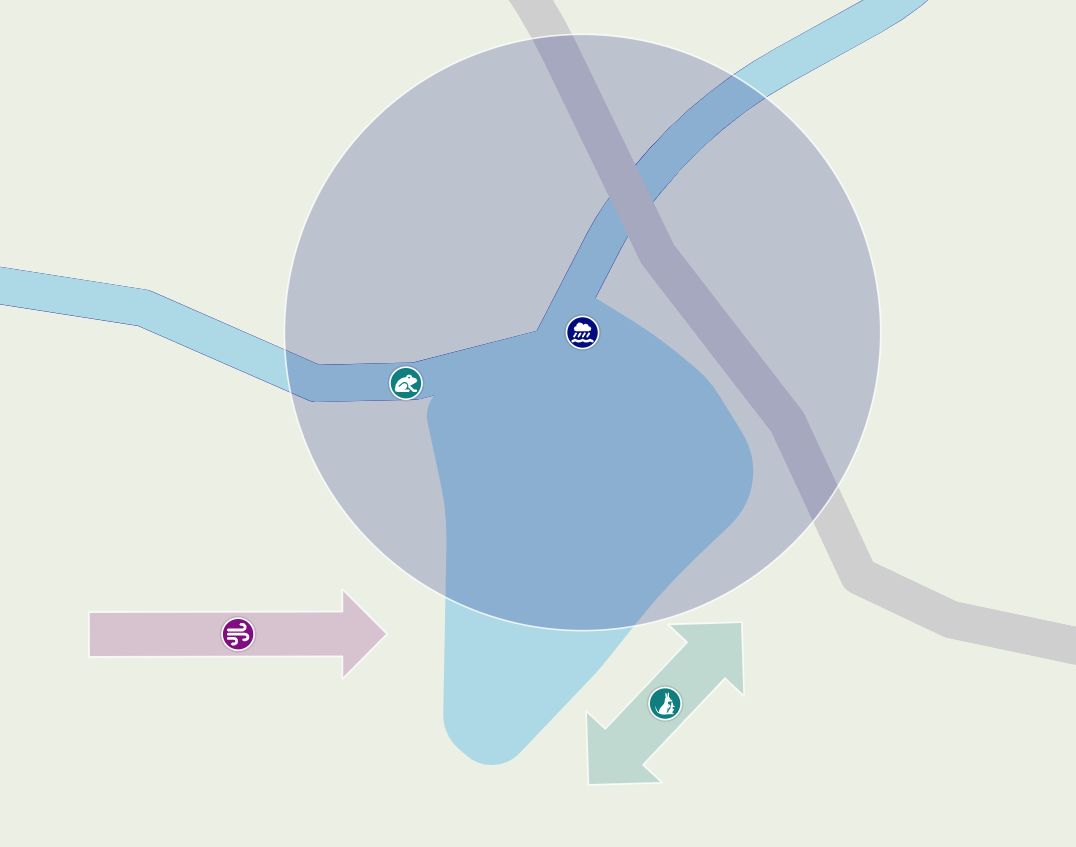
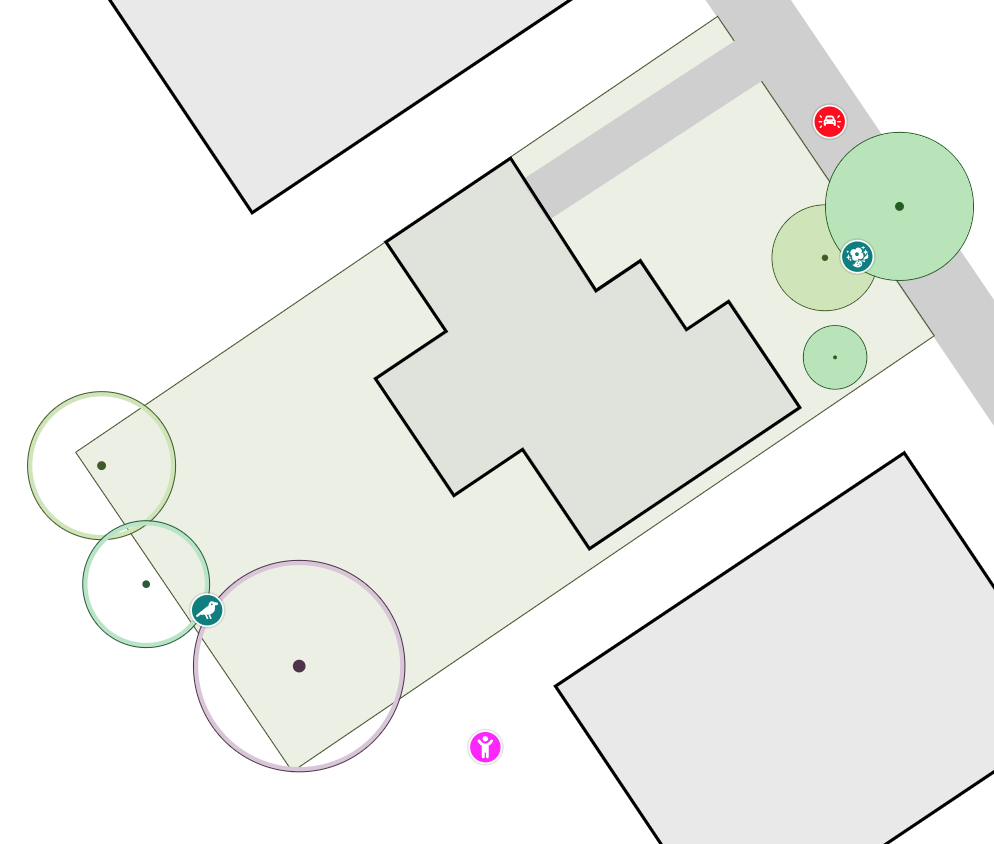
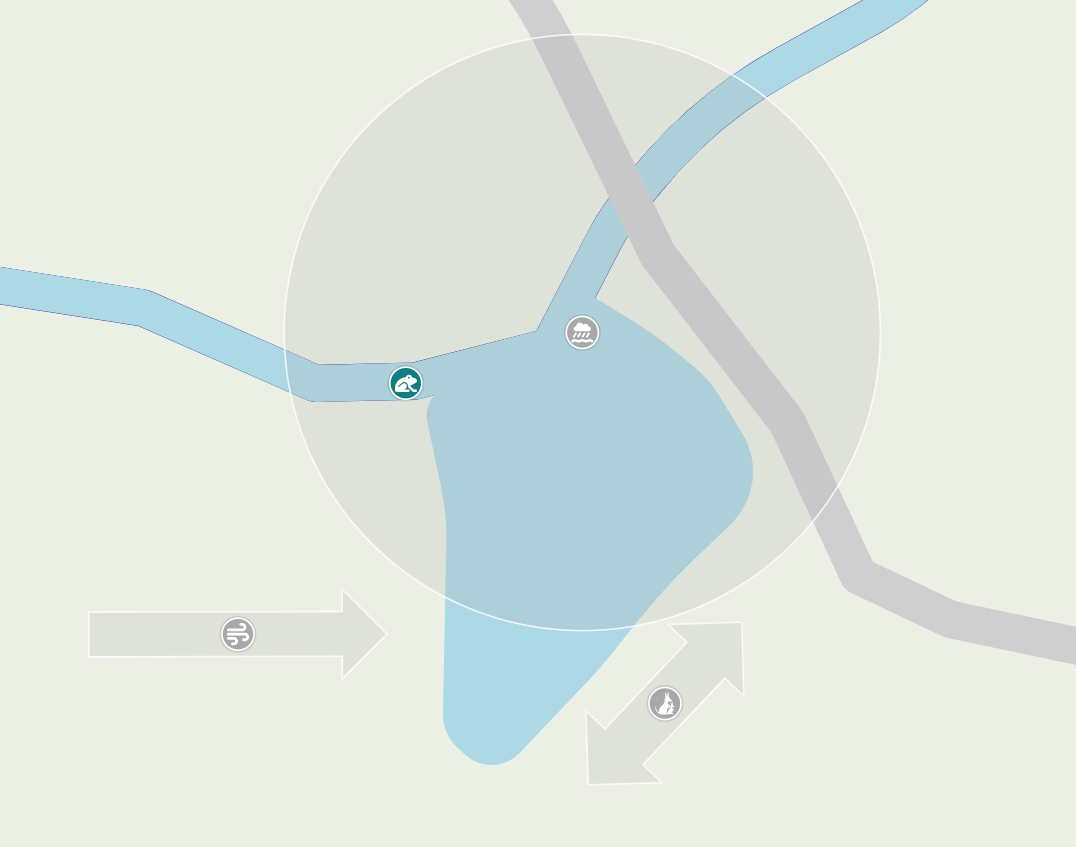
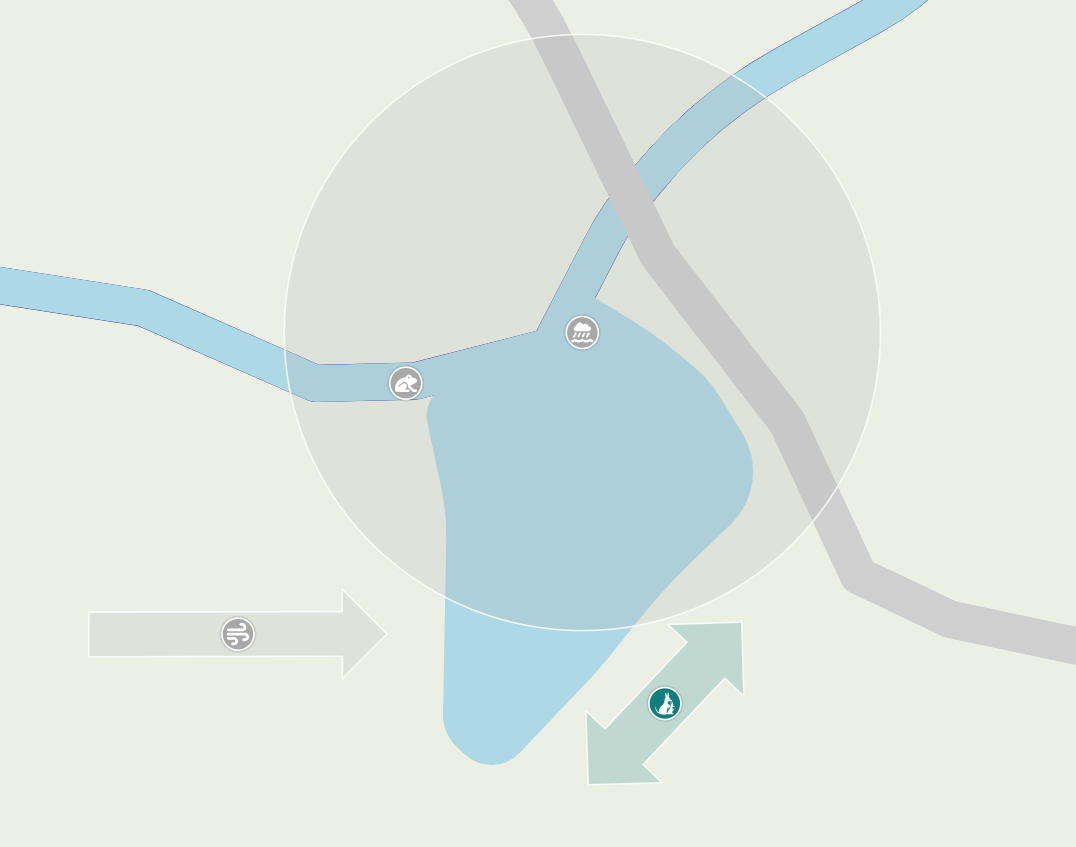
An example of a spot marker is pinpointing a favourite frog habitat near a pond, or marking an individual feature tree. In the examples below, we marked spots where local frogs gather for their chorus and highlighted individual features.
Area Markers
When an observation affects a broader zone, area markers designate the space using circular, square, rectangular, or custom shapes. You can adjust dimensions like diameter or length and width in the properties panel. For irregular areas, change the shape attribute to Custom to drag outline points or curve corners to fit the land accurately.
Example of Using Area Markers
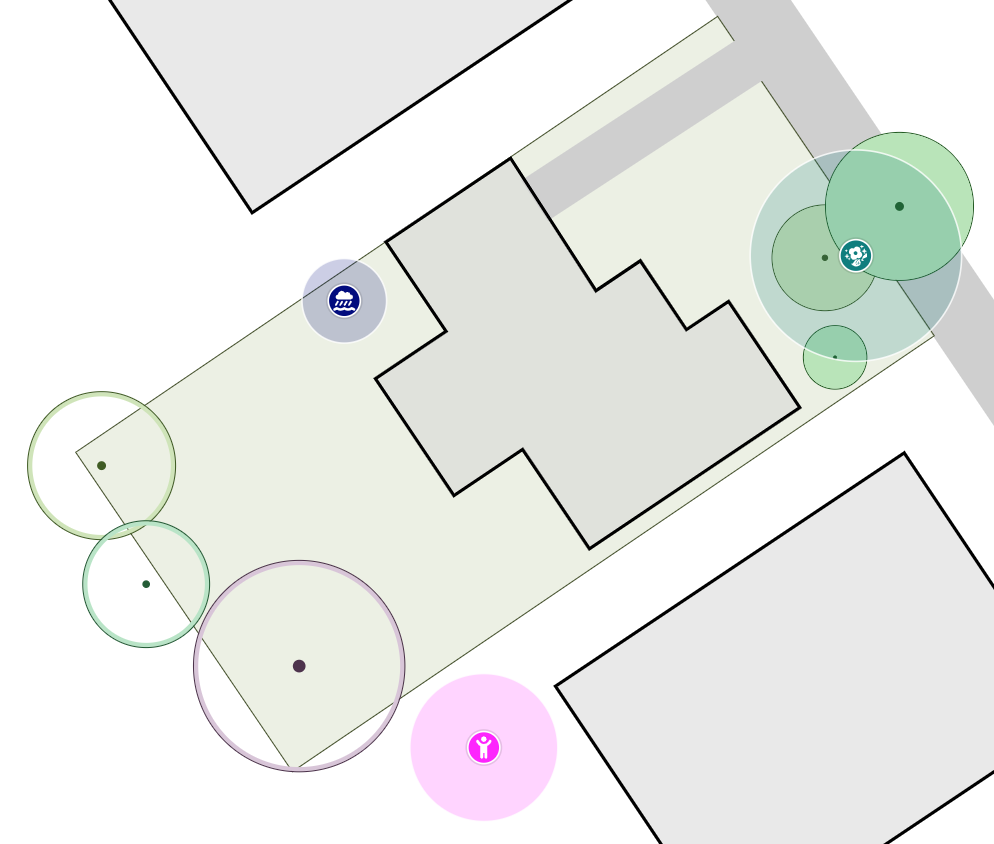
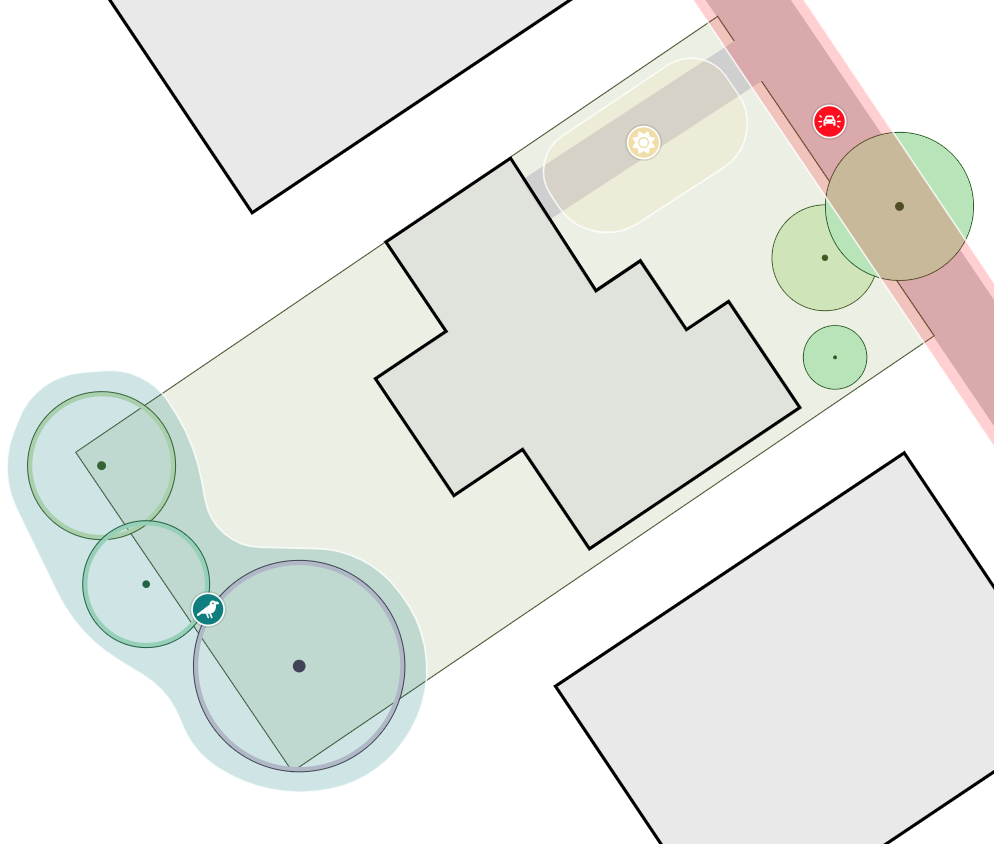
An example of an area marker is defining a wet patch, a full sun zone, or a noisy traffic area. In this example, we used circular and custom-shaped markers to mark our observations.
Directional Markers
Directional markers pair an icon with a directional arrow to show movement across the property. You can turn any marker into a directional marker by changing its shape attribute, then adjust the length, width, and rotation of the arrow to match the observed path.
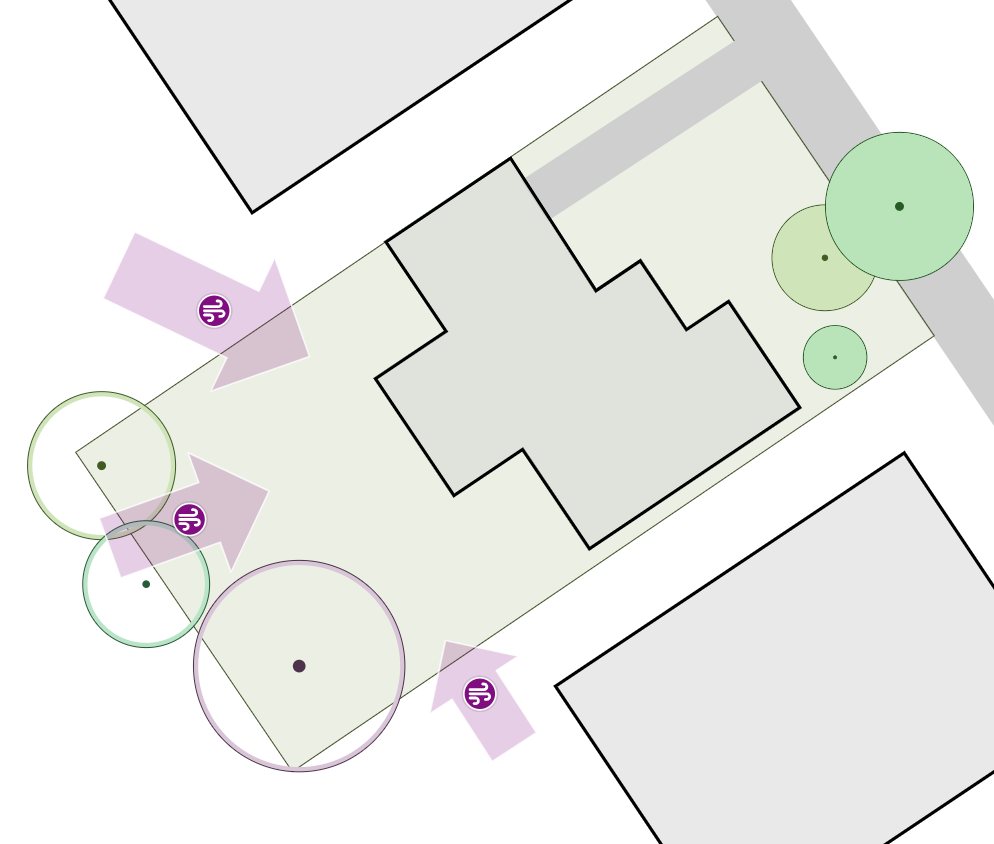
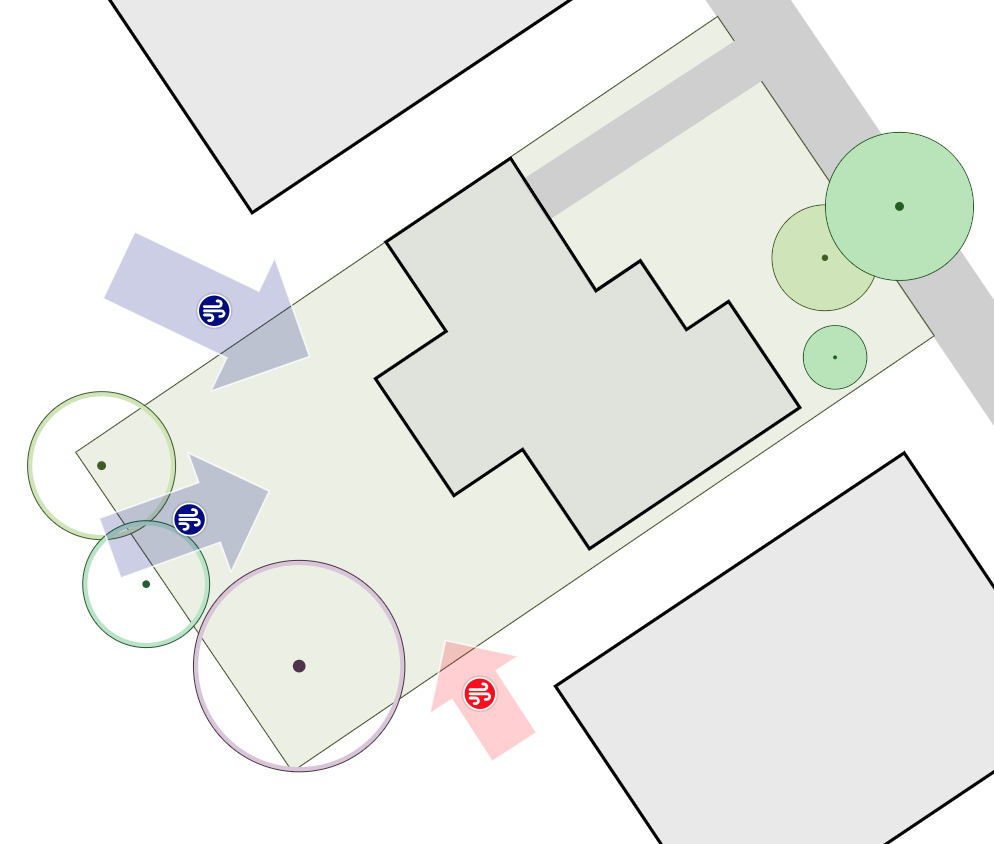
Example of Using Directional Markers to Mark Prevailing Winds
An example of a directional marker is documenting prevailing winter or summer winds. In this example, we used arrow markers and rotated them. By modifying the colour attribute, we added the extra information of seasonality.
Corridor Markers
Corridor markers use a double arrow to represent passage across the landscape. You can turn any marker into a corridor marker by changing its shape attribute, then adjust the length and width of the arrows.
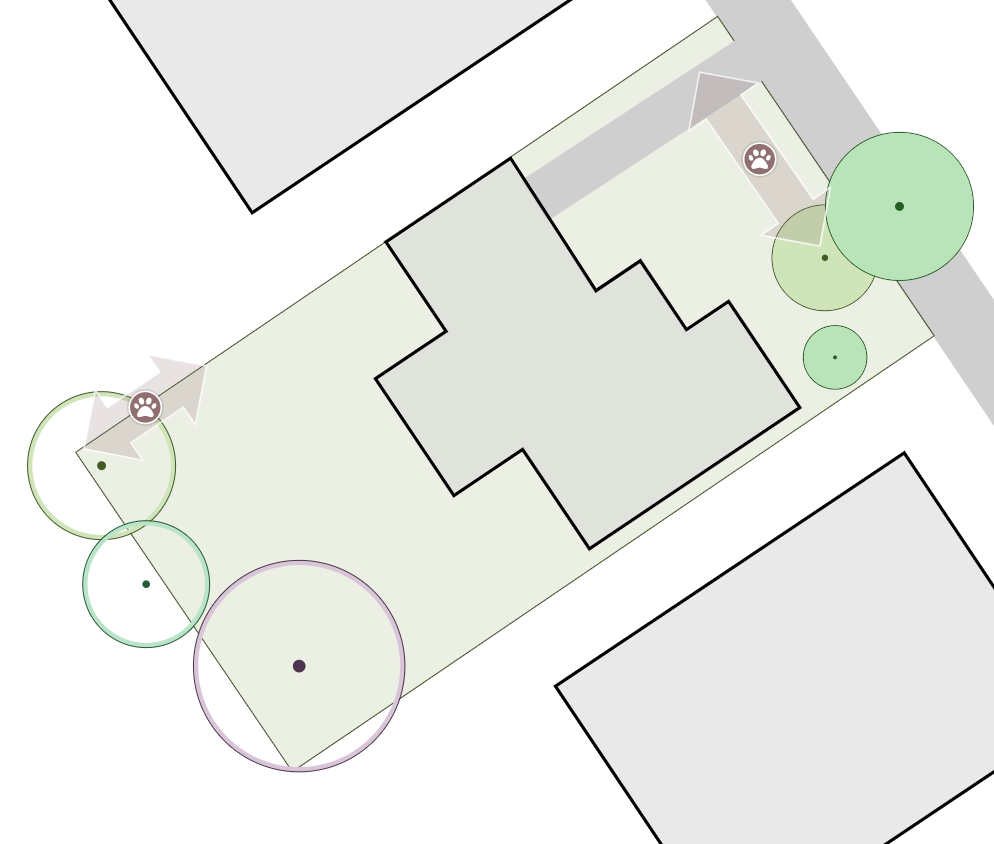
Example of Using Corridor Markers
An example of a corridor marker is mapping a wildlife movement pathway or a main access track. In the examples below, we used the double-arrow shape of site analysis markers to note down kangaroos moving through the area, a dog-walking path, an Australian brushtail possum, and neighbourhood cats walking along the fence edge.
Customising and Organising Markers
Every marker placed on the canvas can be tailored to suit your observations. In the properties panel, you can adjust:
- colour to group related observations or represent negative, neutral, and positive impacts,
- icons and names to specify exact site features,
- labels to display descriptions directly on the drawing canvas.
To save time, you can duplicate markers to quickly repeat custom settings across your design, or set marker attributes in bulk.
Viewing and Filtering Options
Permiehub provides flexible tools to control how markers display on your design drawing:
- labels can be toggled on or off, with adjustable text size for readability,
- a greyscale toggle switches the canvas to greyscale to simplify drawings for printing or ground-truthing,
- custom view filtering drains colour from specific marker shapes or hides individual marker categories entirely to focus on specific analysis layers.
For a detailed walkthrough on how to place, resize, and customise each marker type, read more about drawing site analysis markers step by step.
Sun Tool
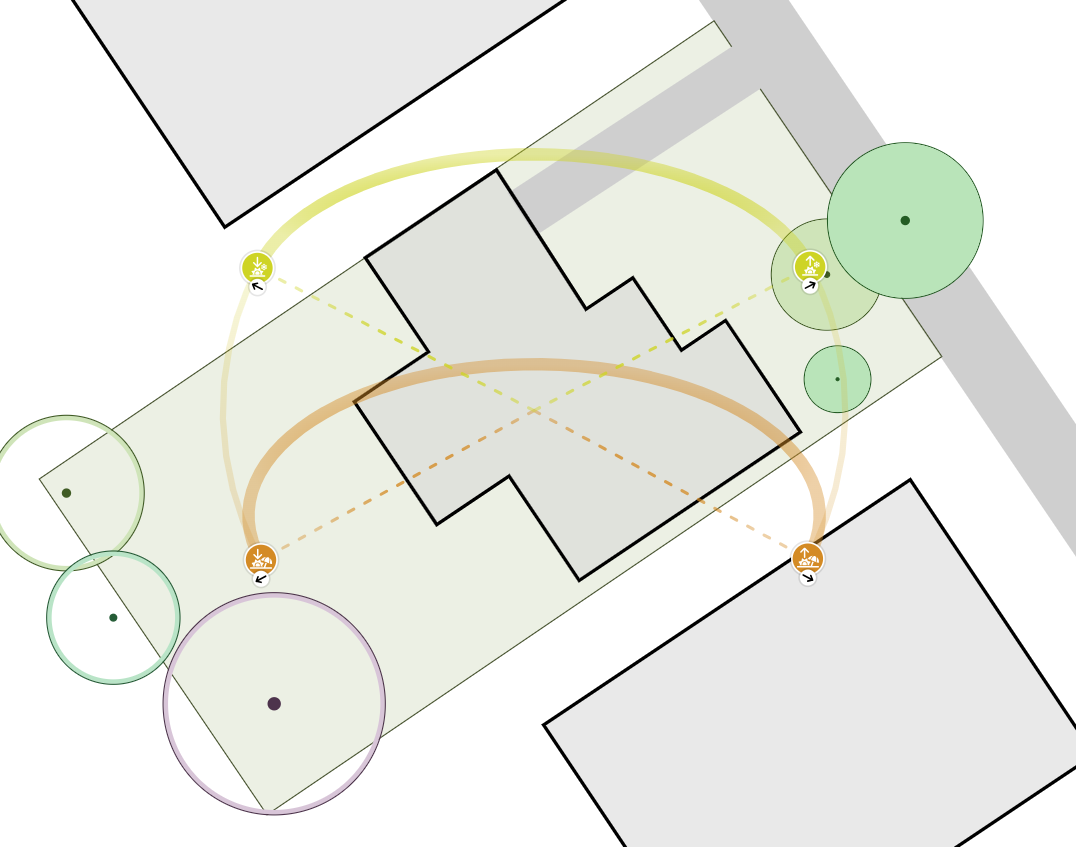
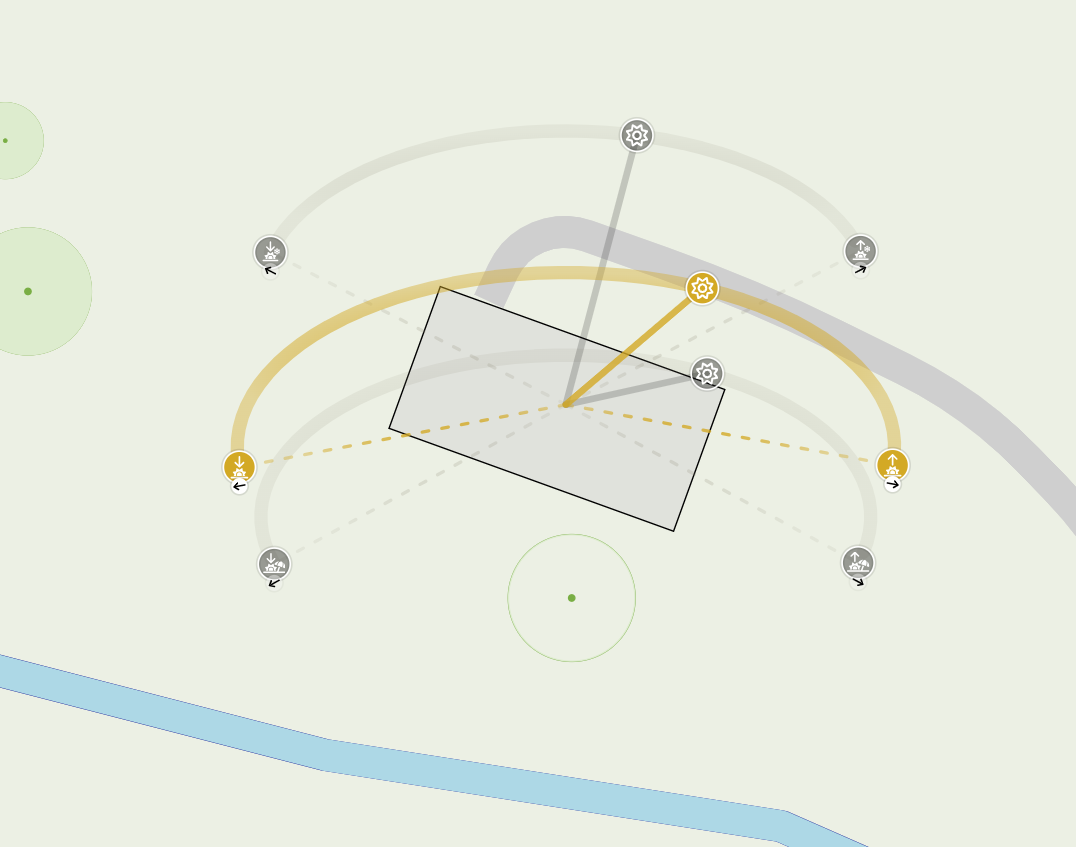
The Sun Tool shows the sun’s movement, serving as a practical reference when designing shelter or positioning plants. By default, it displays the summer and winter solstices, though you can view movement at any time of year. Moving and resizing the visualised pathway around your design reveals how solar angles affect your property.
When the Base Map Wizard imports data, it automatically adds one Sun Tool based on your location. To protect your privacy, exact coordinates are never stored, and the tool uses an approximate position by rounding latitude and longitude. You can also change the values at any time or create additional Sun Tools anywhere on your block.
Sun Path for Time of Day and Month
When the Sun Tool has the correct latitude, longitude, and timezone, you can visualise the sun’s path for a specific month and time of day by changing its attributes. To learn more about changing the latitude and longitude of the Sun Tool on your design, or showing and hiding the sun path for a particular month and time, navigate to the page about drawing the sun path with the Sun Tool.