Drawing Trees & Plants
Learn how to place, resize, and visualise plants and trees with transparent centres, as tropical palms, or as espaliers.

Visualise Your Planting Plan in 3 Easy Steps
1. Place Your Plant
Select one of the Plant tools and click anywhere on your canvas to place your individual perennials, shrubs, or trees.2. Adjust Plant Attributes
Set canopy size, plant shape, colour, labels, and timing for blossoms, fruit, and leaf cycles to plan yield processing and seasonal shade.3. Highlight & Export
Toggle implementation states, highlight seasonal yields, and export high-contrast maps for printing or sharing.Choose the Right Tool for the Job
Permiehub provides several specialised drawing tools to visualise different styles of plantings on your site plan. Match your goal with the table below to find the right feature.
| Best Used For | Tool | Key Attribute | Tip |
|---|---|---|---|
| Feature or freestanding trees or plants, including tropicals | Plant | Individual canopy spread, foliage type, or tropical shape | To repeat multiple plants of the same species, consider the Hedge or Planting Row tools. |
| Fruit trees, berries, and vines trained flat against supports | Espalier | Segment length, thickness, and foliage attributes | To showcase structures instead of plants, use the Pergola or Trellis tools. |
| Uniform privacy screens, living borders, and monoculture hedges | Hedge | Line path with corners, thickness, and height | For multi-species planting, use the Planting Row tool instead. |
| Food forest rows, syntropic agroforestry, or swale plantings | Planting Row | Total row length, spacing, and plant counts | For standalone feature trees, use the Plant tool. Read the guide about planting rows. |
| In-ground or raised flower and vegetable beds | Garden Bed | Defined rectangular, oval, or round shape | To detail plants in a bed, add labels or a description. Read the guide about garden beds. |
| Custom garden zones, irregular borders, or groundcover areas | Garden Area | Freeform geometric or organically shaped polygon | To define individual plants, use the Plant tool, or repeat Planting Row lines to create a detailed area design. Read about drawing shapes. |
Backyard with various types of plantings
Freestanding deciduous, evergreen, and tropical plants
Hedges and espaliers of various lengths
Round, oval, and rectangular garden beds
Planting rows with mixed canopy types
Custom organic garden area polygon
Benefits of Designing Trees and Shrubs with Permiehub
The Evergreen, Deciduous, and Tropical Plant tools help you visualise standalone plants, perennials, orchard trees, or feature species on your site plan. They simplify detailed design when you want to:
- position standalone orchard trees and specimen shrubs quickly,
- visualise mature canopy spread to avoid overcrowding and manage shade across lower growing zones,
- track and showcase monthly flowering, fruiting, and leaf cover for year-round pollinator forage, yield, and shade planning,
- toggle between planned features and already implemented trees,
- highlight individual trees in an existing design using custom filters,
- label specific species or cultivars to keep an accurate historical record of your site.
Starting Point
To map trees and plants in your design successfully, open your editable project in Permiehub. Knowing the sun orientation, prevailing wind directions, and soil conditions of your site will help you place species in their ideal microclimates. You can map site observations including the sun path for your site at any time of the year and even at a particular time of day in the Site Analysis overlay.
Step 1: Place Freestanding Plant
To start placing trees in Permiehub, select the Plant tool from the menu in your project. Click anywhere on your canvas to drop an icon representing your plant canopy.
Adjust Size Before Placing
Optionally, before stamping it down onto your canvas, you can set the size of your plant. Once you choose the tool, the bottom right corner shows the Canopy Diameter field, which you can modify. Alternatively, type the diameter on your keyboard and confirm it by pressing Enter. See the example in adjust canopy size.
Step 2: Customise Canopy, Colour, and Seasonal Attributes
Once your tree is placed on the canvas, you can adjust its attributes to match the exact species you plan to grow along with other properties like shape, colour, and size.
Adjust Vertical Position
As you place objects on your drawing, they layer on top of each other. Sometimes you want smaller trees or perennial plants in tree guilds to sit underneath the canopy of larger trees, or established trees to display above a building roofline or structure.
To change the vertical order of objects, adjust their visual layer position. Select your tree and use the layer ordering buttons in the top menu. The four arrangement icons allow you to Raise to Top, Raise, Lower, or Lower to Bottom.
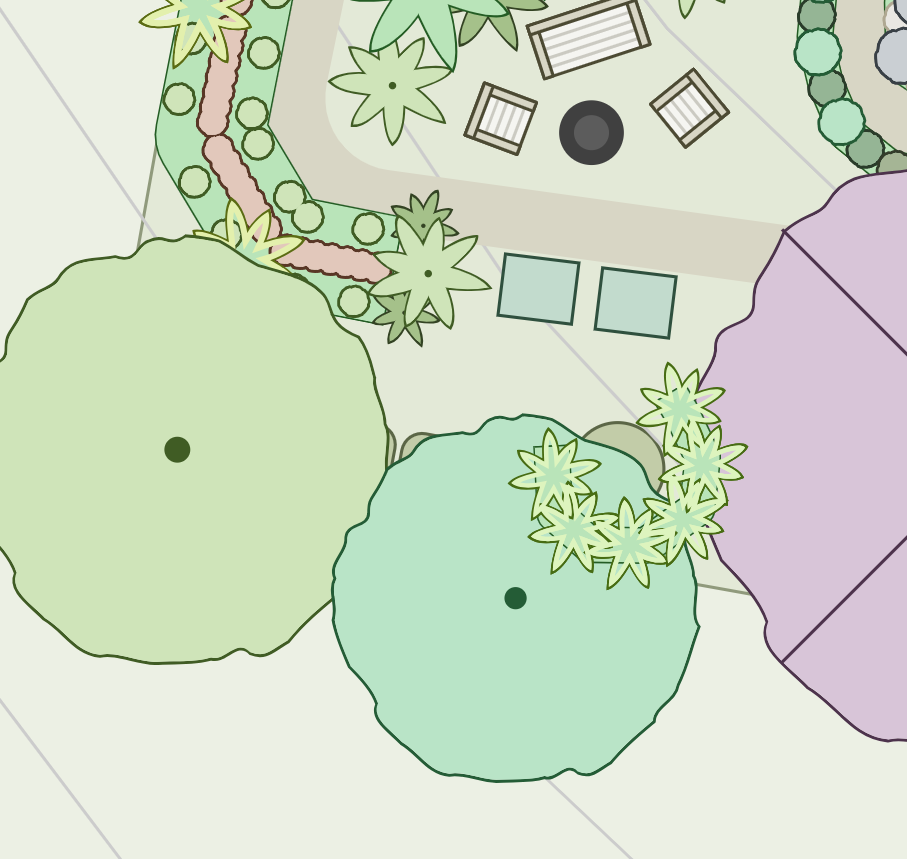
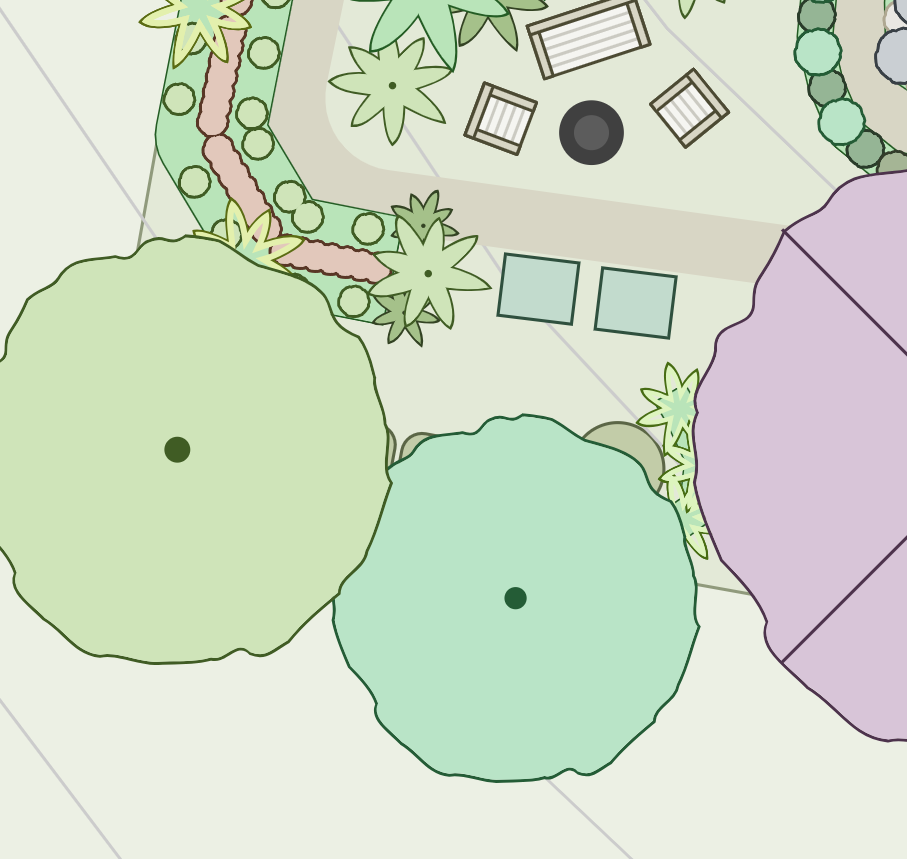
Example of Adjusting Visual Layering of Overlapping Canopies in Permiehub
In the example below, we placed a planting row of banana pups around an existing circular composting area. The partial circle of plants initially appeared on top of the large middle tree. We could have moved the banana circle lower by using the Lower button, but instead we selected the large trees and rearranged them to the top, as there are almost no taller objects on our drawing.
Adjust Canopy Size
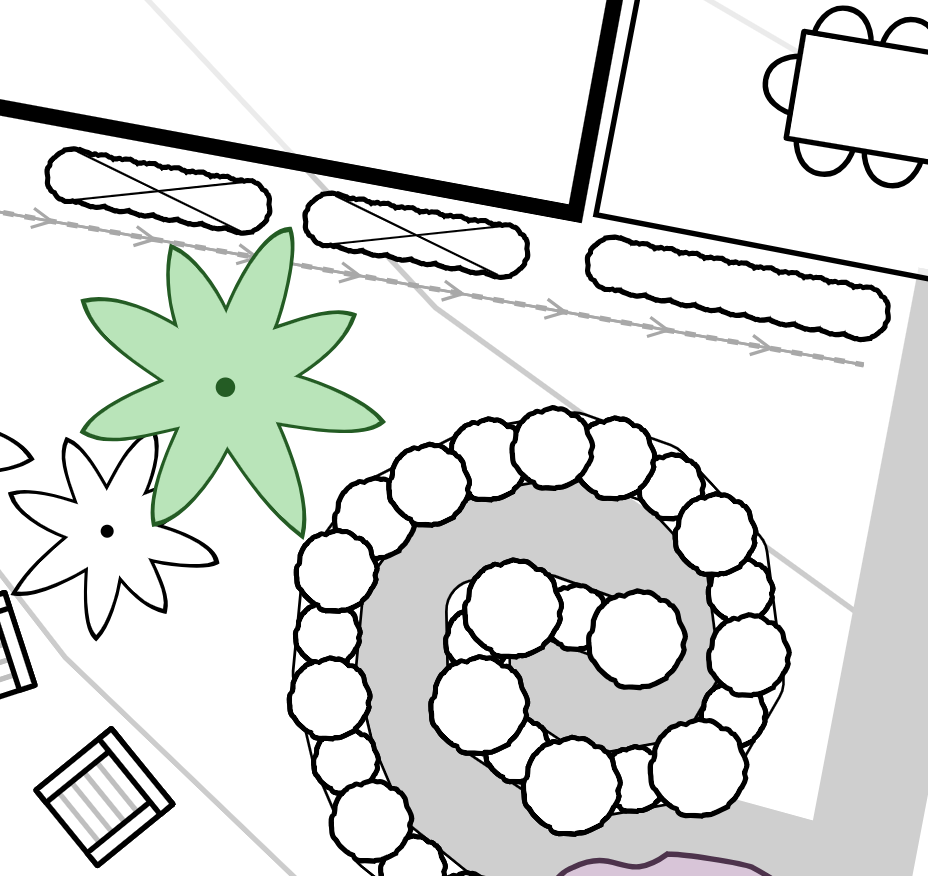
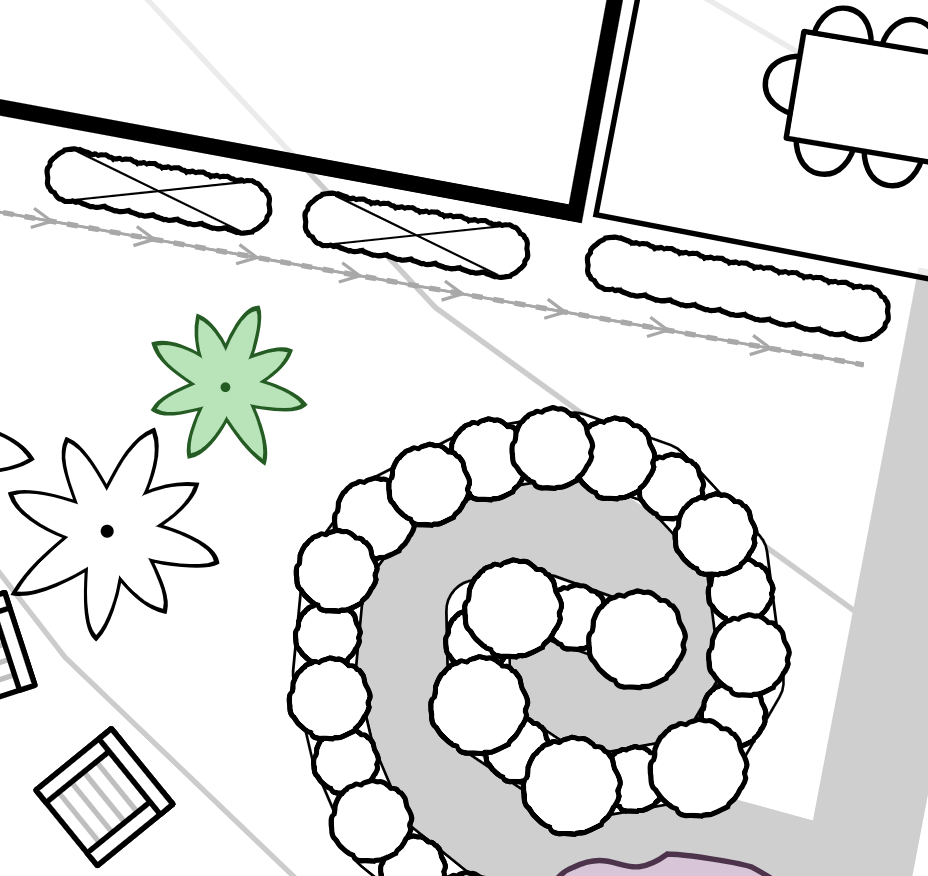
To change the size of your plant on your drawing, select it and use the corner square-shaped handles of its outline box to enlarge or shrink it. By default, canopy resizing maintains a square one-to-one aspect ratio. If you want to create an asymmetrical or oblong canopy, hold the Shift key while resizing to turn off proportional locking and set custom width and length dimensions.
Example of Resizing a Plant Canopy in Permiehub
In this example, we select a plant on our greyscale drawing to adjust its overall size. The first image shows the plant at its default canopy width, while the second image shows the plant enlarged using its corner selection handles to cover a wider growing area.
Change Canopy Colour
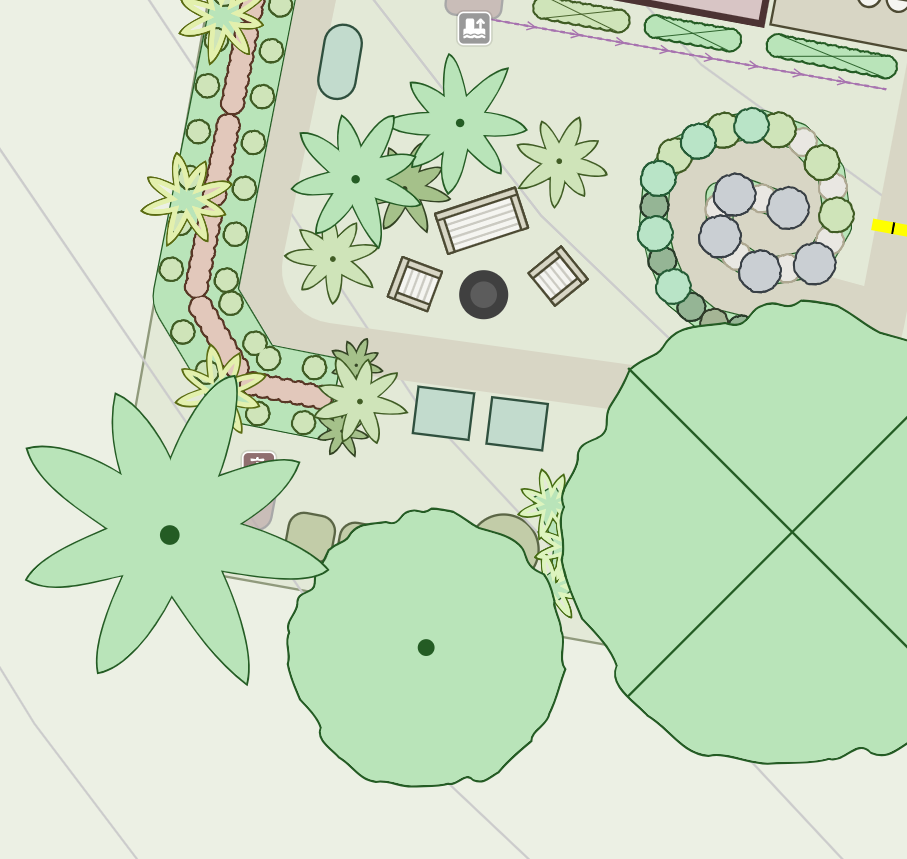
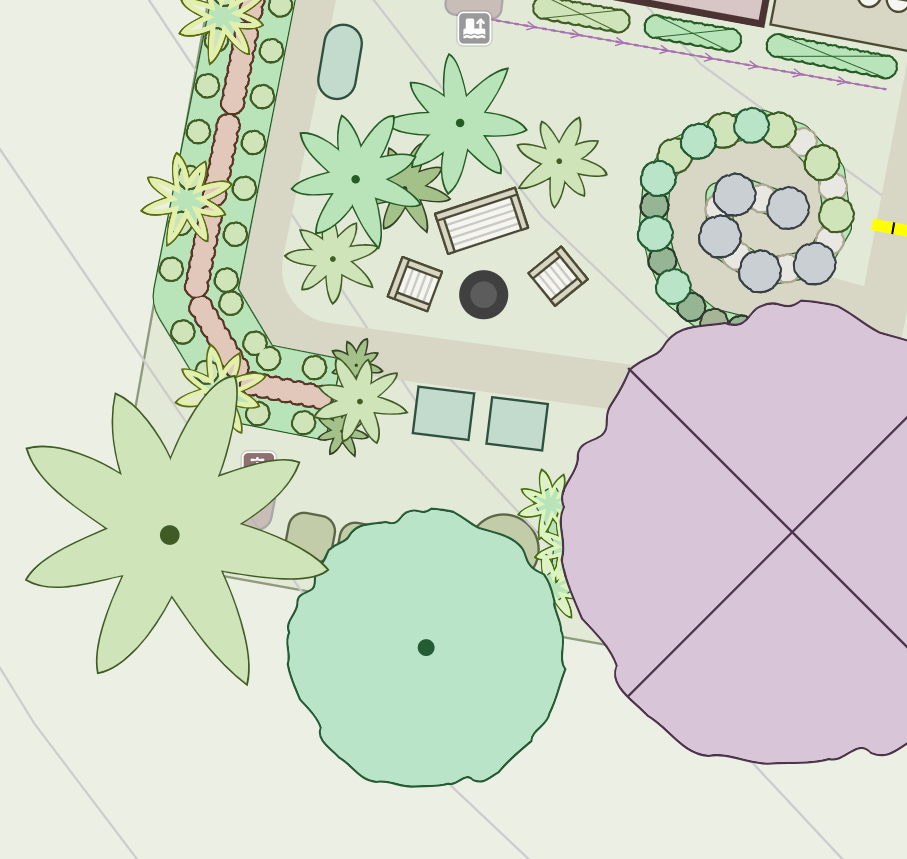
To update the visual appearance of a plant, select the object on your canvas and open the Canopy Colour picker in the attributes panel. Custom colours help you differentiate plant varieties, foliage types, or garden zones at a glance. We like to colour-code trees to quickly remind us of the tree by its fruit or foliage shade.
Example of Changing Plant Colour to Represent Foliage or Fruit in Permiehub
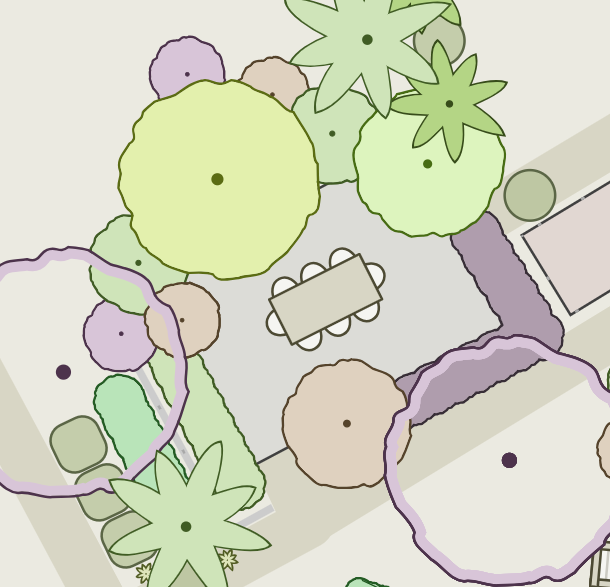
In the images below, we changed the three major trees from their initial colour to shades representing their foliage and fruit. The large deciduous tree shows in the second image in purple to represent mulberry fruit.
Change Plant to Tropical Shape
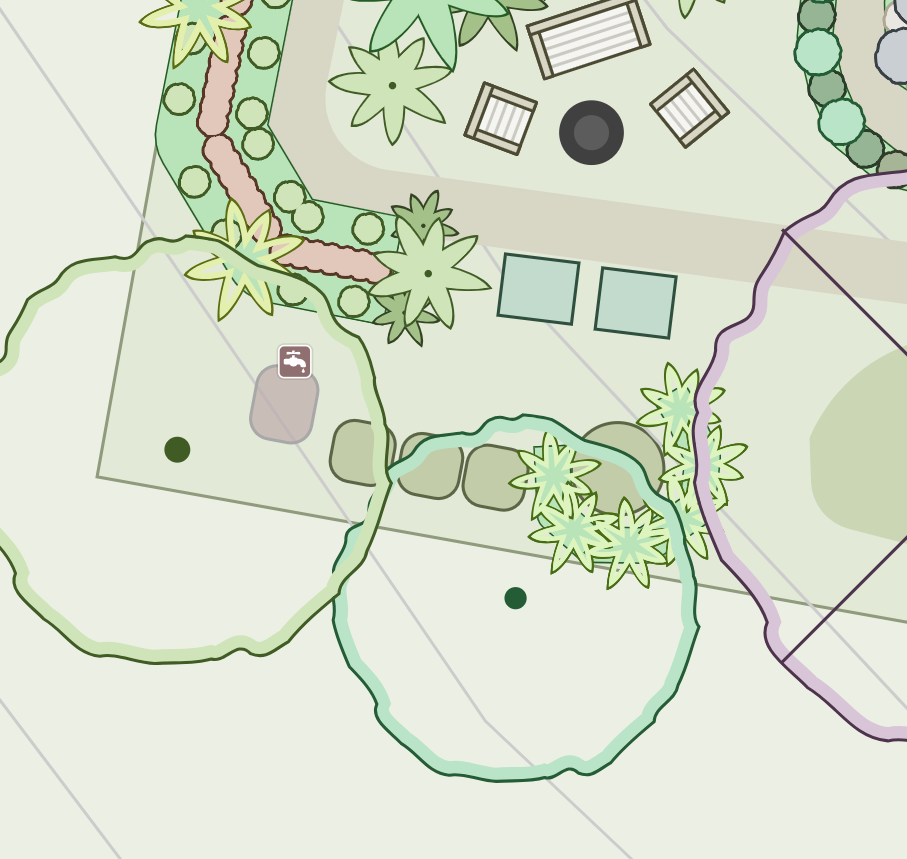
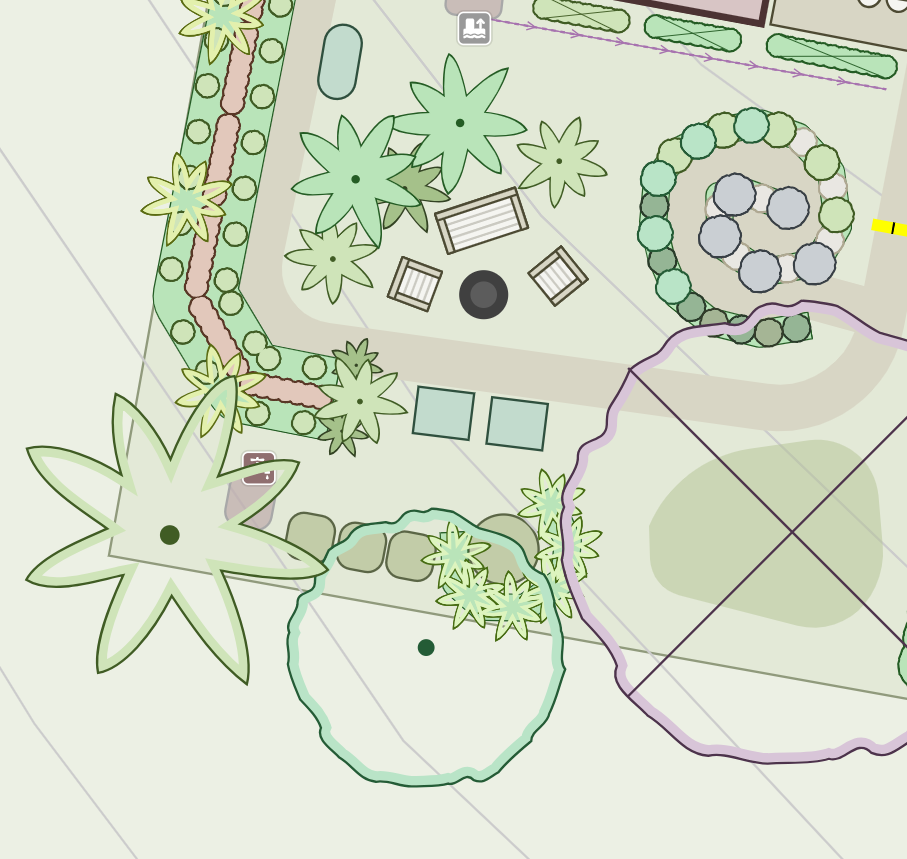
To switch the visual icon style on your map, select the plant and update the Plant Shape attribute in the parameters panel. You can choose between a standard tree shape and a tropical palm-like shape.
Example of Changing a Tree Canopy to a Tropical Palm Shape in Permiehub
In this example, we wanted to modify the canopy shape of the tree on the left from a standard shape to a palmate shape. The first image shows regular rounded tree icons on the drawing, while the second image shows one of those plants updated to a tropical look.
Change Plant to Deciduous
To switch between deciduous and evergreen foliage, adjust the Evergreen attribute under the foliage section. Changing this attribute toggles the deciduous pattern on standard tree canopies, but it does not alter the visual appearance of the palm shape.
Deciduous plants display an X pattern across the canopy icon on your map, indicating seasonal leaf loss. You can specify when your trees lose their leaves by setting the Bearing Leaves attribute in their Foliage section.
Change Plant to Espalier
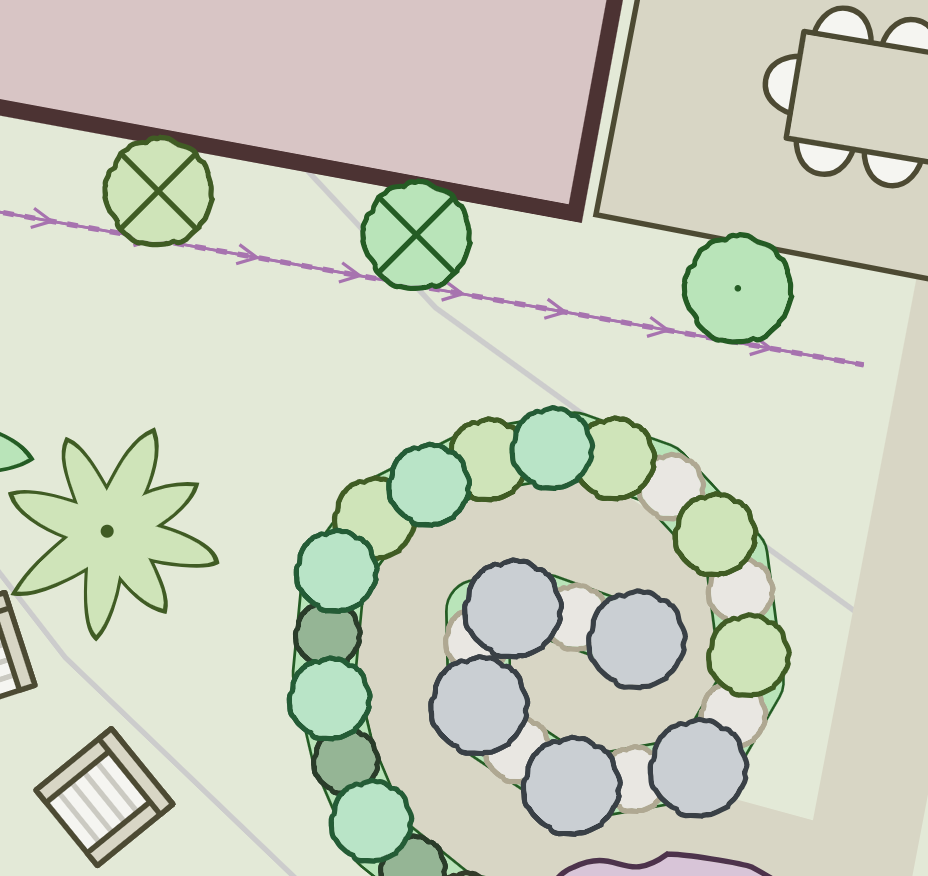
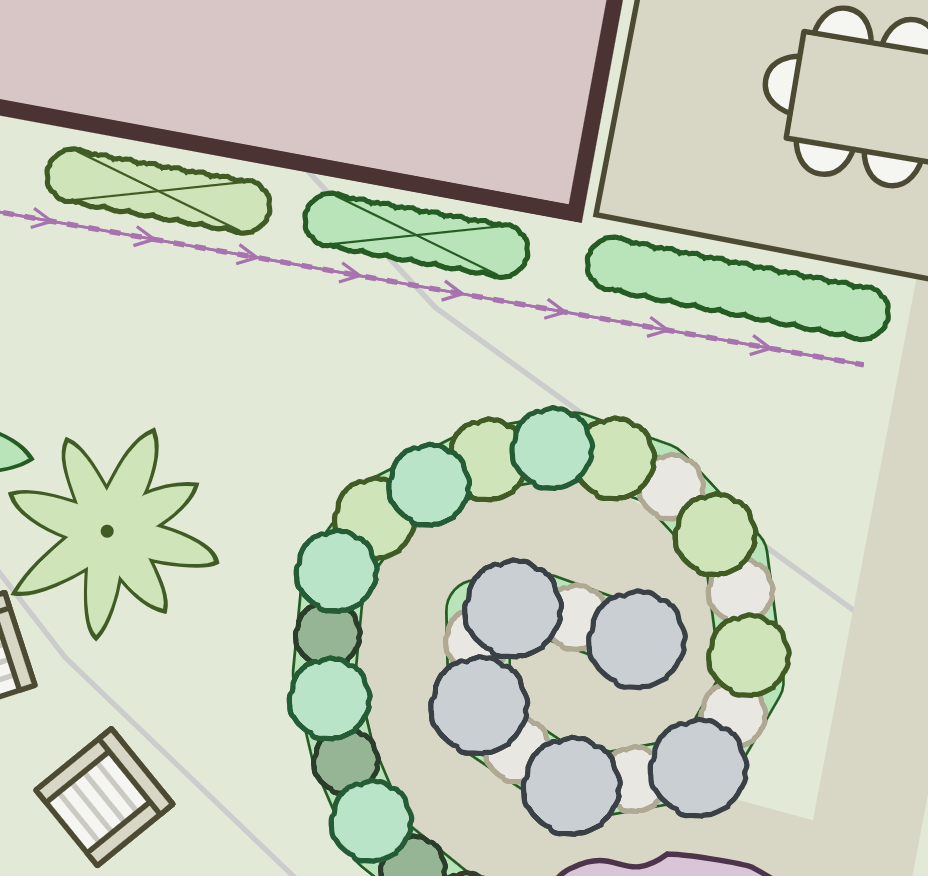
To convert a freestanding tree into an espalier, select the plant on your canvas and locate the Espaliered / Hedge attribute. Turning this attribute on flattens the round canopy into a linear trained shape, making it simple to map fruit trees, bushes, and vines along fences, walls, or trellises.
Example of Converting Freestanding Trees to Espaliers in Permiehub
In this example, we wanted to convert freestanding young fruit trees into espaliered lines along one of the house walls to save space and allow us to net the trees in the future. The first image shows the original fruit tree shapes, while the second image shows those same plants flattened into espalier lines aligned with the structure.
Change Canopy Transparency
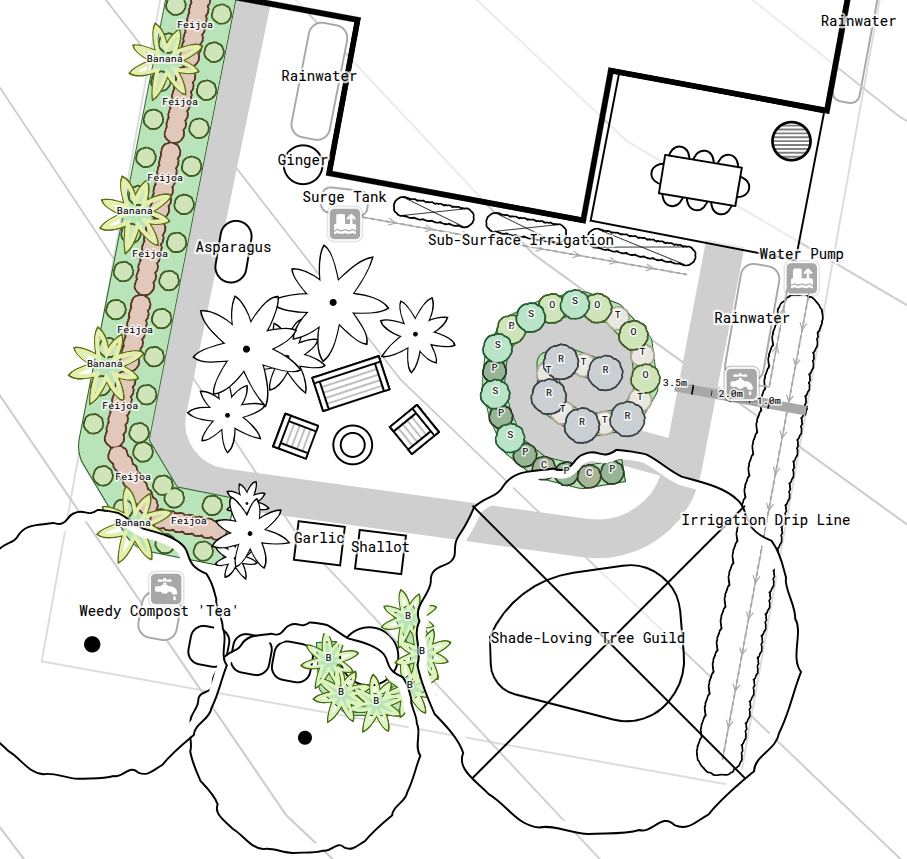
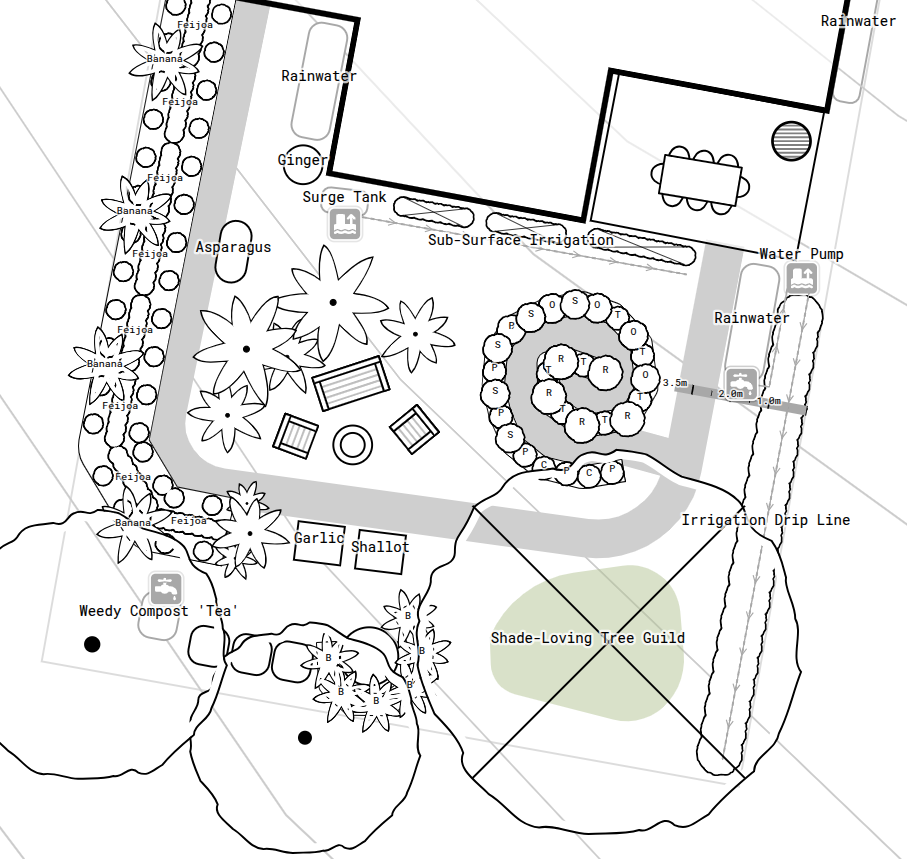
To see ground-level features under a large canopy, select the tree and adjust its Transparent Centre attribute. Enabling it allows path lines, swales, understorey plants, or infrastructure to remain visible beneath the upper tree canopy. We find this attribute especially helpful in designs with large feature trees or when designing tree underplanting. For more complex planting designs, we use the Planting Row tool.
Example of Making Tree Canopies Transparent in Permiehub
In this example, we wanted to view the composting area running underneath the canopy of mature trees. We selected the trees on our canvas using multi-select and enabled the Transparent Centre attribute. The centre of the canopy becomes see-through, showing the ground details beneath while keeping the outer drip line visible to mark the horizontal extent of the tree.
Label Plant Species
Adding labels helps you record specific tree varieties directly on your map and make designs readable to others. Select the tree, locate its Label attribute, and enter the name of the plant species or cultivar. In complex designs with dense plantings, you might want to choose an abbreviation or a code word and then provide a full name in other attributes like the Name. Organising information about plants will help you generate a legend for your design drawing.
Important Notice
To view labels on your drawing, ensure the label toggle in the top-right corner of your canvas is switched on.
Example of Adding and Resizing Labels on Espaliered Trees in Permiehub
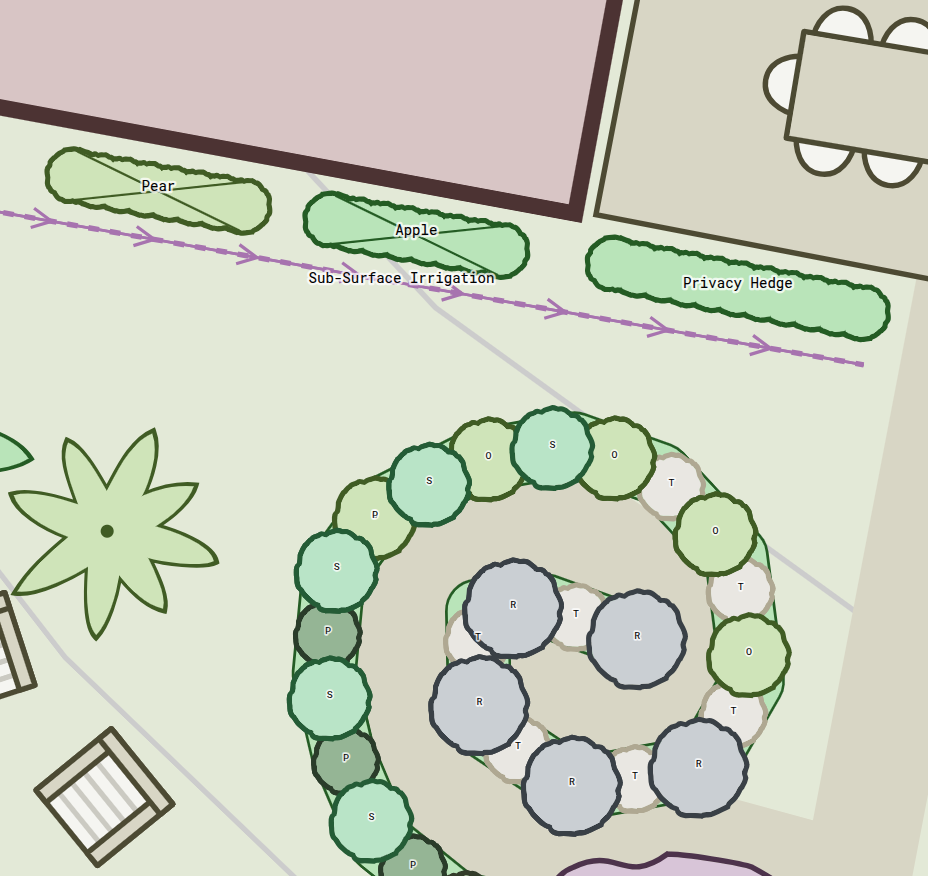
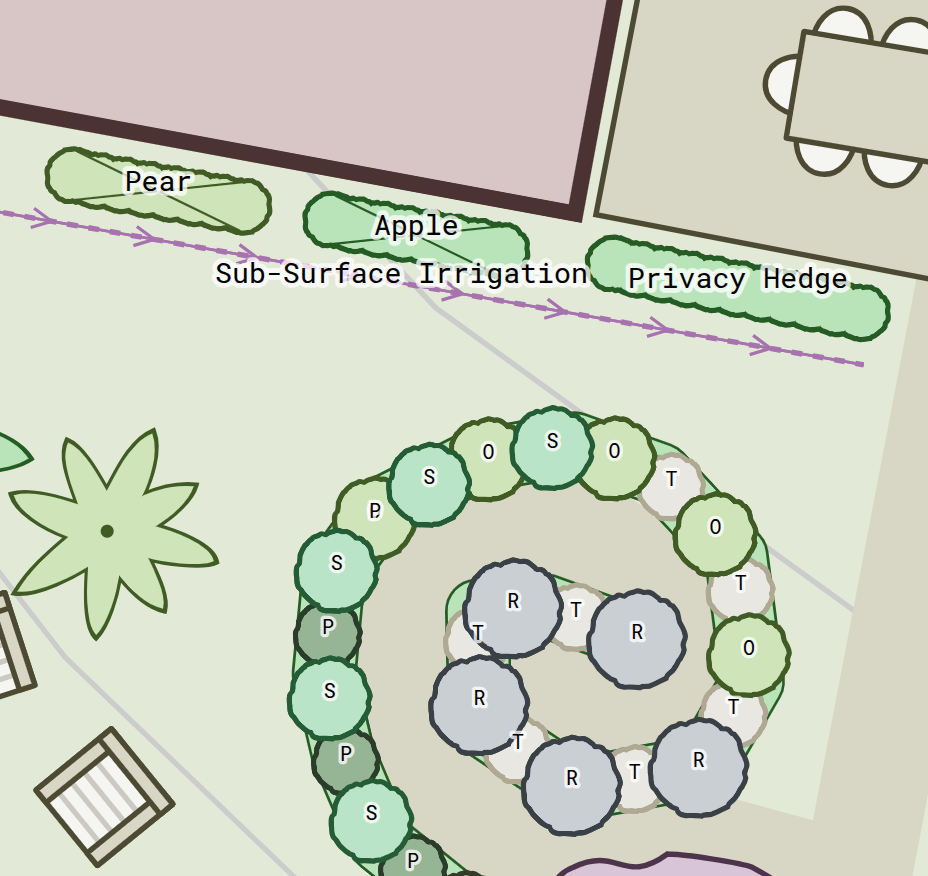
In this example, we wanted to make our drawing readable for others reviewing it. We added labels to convey the species of espaliered fruit trees and a privacy hedge. We then adjusted the label size. The first image shows the espaliers without labels, the second image shows labels added on top of each tree, and the third image shows those labels enlarged for easier reading on printed maps.
Set Flowering, Fruiting, and Leaf Schedules
Filling out details such as flowering, fruiting, and leaf coverage for your plants will allow you to highlight plantings with that attribute for any month.
To configure seasonal parameters in the attributes panel, select your plant on the canvas. You can select the specific months when the plant flowers, produces fruit, and holds or loses its leaves.
For evergreen plants, select all twelve months for foliage coverage. For deciduous trees or herbaceous perennials that die back, select only the active growth months when foliage is present, leaving dormant months unselected to indicate leaf drop.
If you value flowers for pollinator forage or wish to maintain visual interest in your garden with colourful or fragrant blossoms, set the Flowering attribute for each plant.
Once you fill out the defaults for your planting, you can highlight plants flowering, fruiting, and bearing leaves for each month using highlighting.
Step 3: Track Implementation and Seasonal Highlights
Detailed design involves more than placing tree icons on a map. By filling out seasonal and operational attributes for each plant, you can manage workload and visualise planned yield across the year.
Highlight Implemented Elements
If you update the implementation status attribute of your plants, you can switch views between what is currently planted and what remains in the planning phase. In the overlay menu, click the clipboard icon to toggle this view. A checkmark on the clipboard indicates completed plantings, while a list displays future projects.
Highlight Flowering, Fruiting, and Leaf Drop
By entering the months when your trees produce blossoms, bear fruit, or drop leaves, you can review seasonal patterns for any time of year. To turn on seasonal highlighting, click the highlighter marker icon in the overlay menu and select a specific month to inspect.
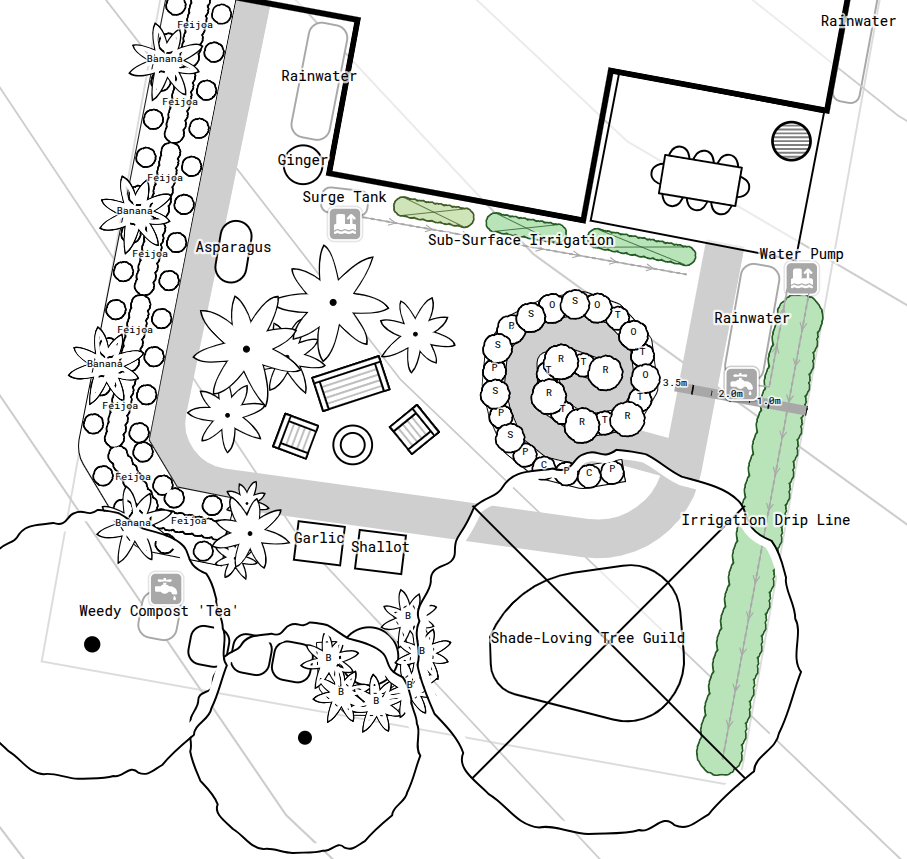
Example of Highlighting Seasonal Yields and Custom Filters in Permiehub
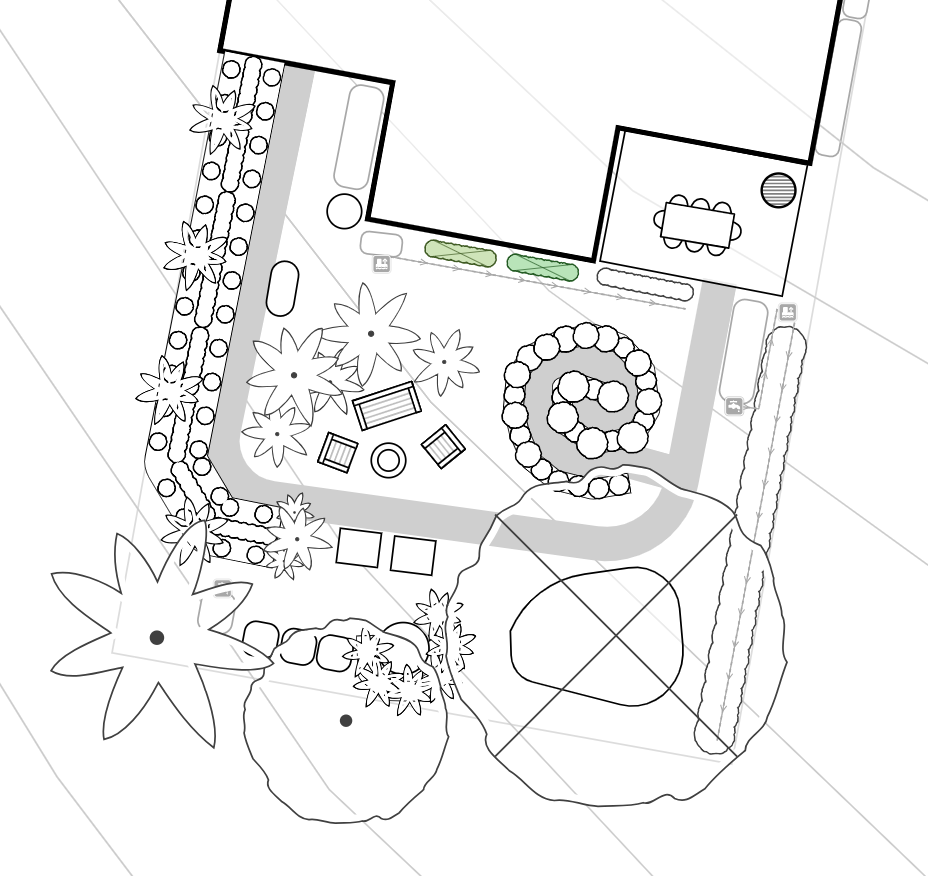
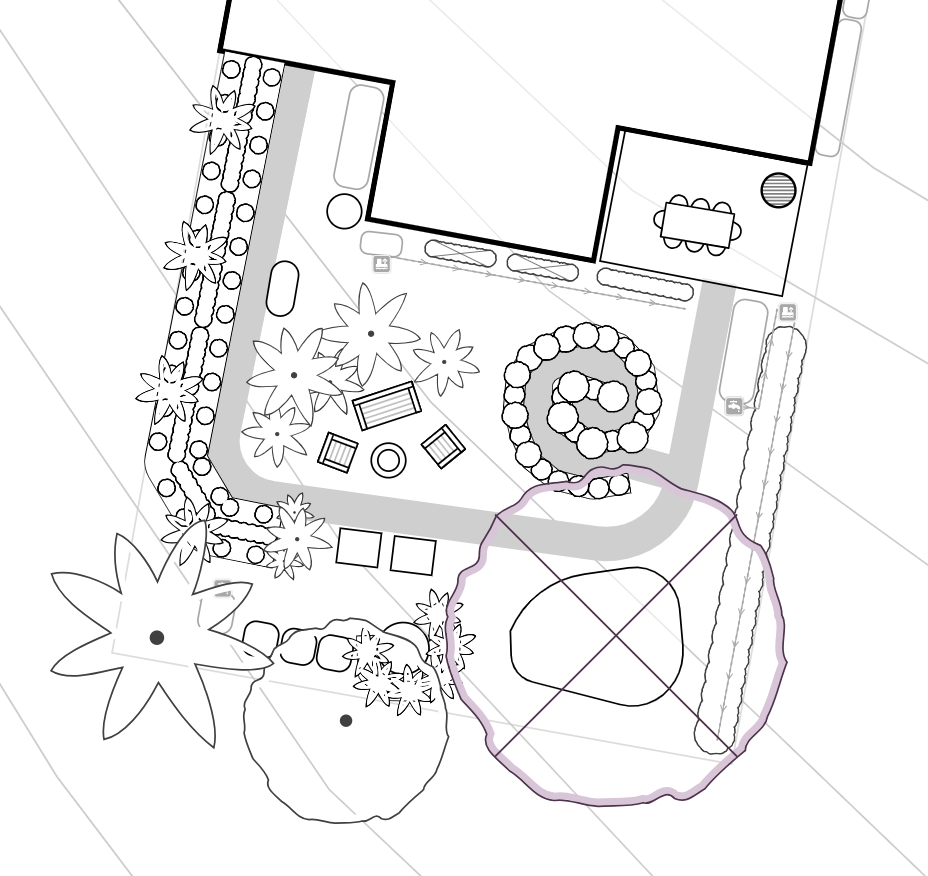
In the example images below, we highlighted productive plantings of standalone trees. We set the fruiting times for a large dark mulberry tree, colour-coded in purple, and two small espaliered trees near the house. We then used highlighting in the Detailed Design overlay menu to showcase fruiting trees in summer and a mulberry tree producing in autumn. To make the trees stand out further, we turned the rest of the canvas to greyscale using custom filters.
Step 4: Export Tree Drawing
Once your tree placements and attributes are configured, export your design as a printable PDF using the Download to Print tool.
Enable or Hide Labels
Toggle the label switch in the top-right corner to show or hide species names. Adjust label sizes using Enlarge Labels or Shrink Labels before exporting your design drawing into a PDF file.
Example of Enabling and Hiding Labels on Canvas in Permiehub
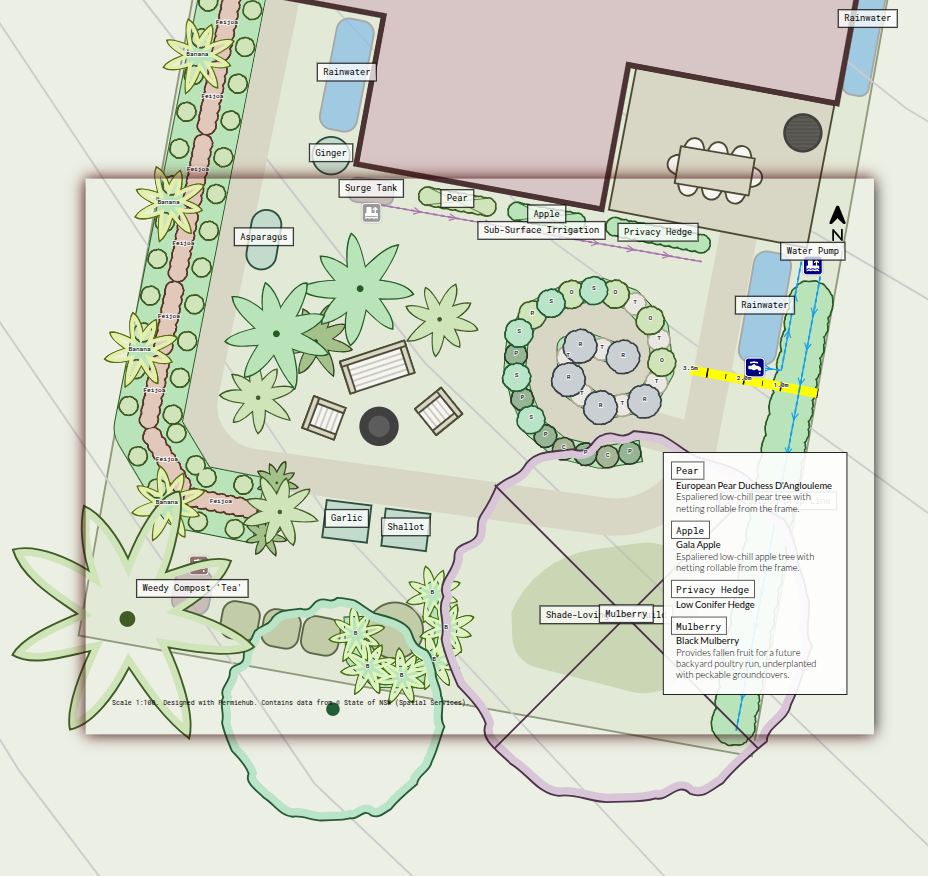
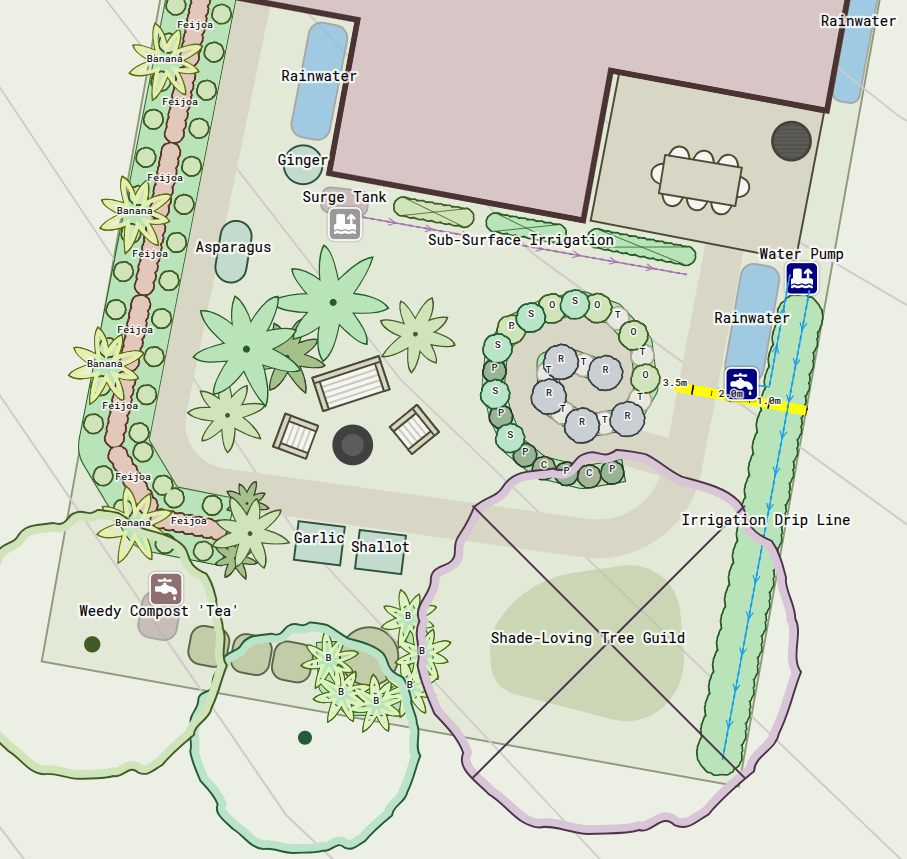
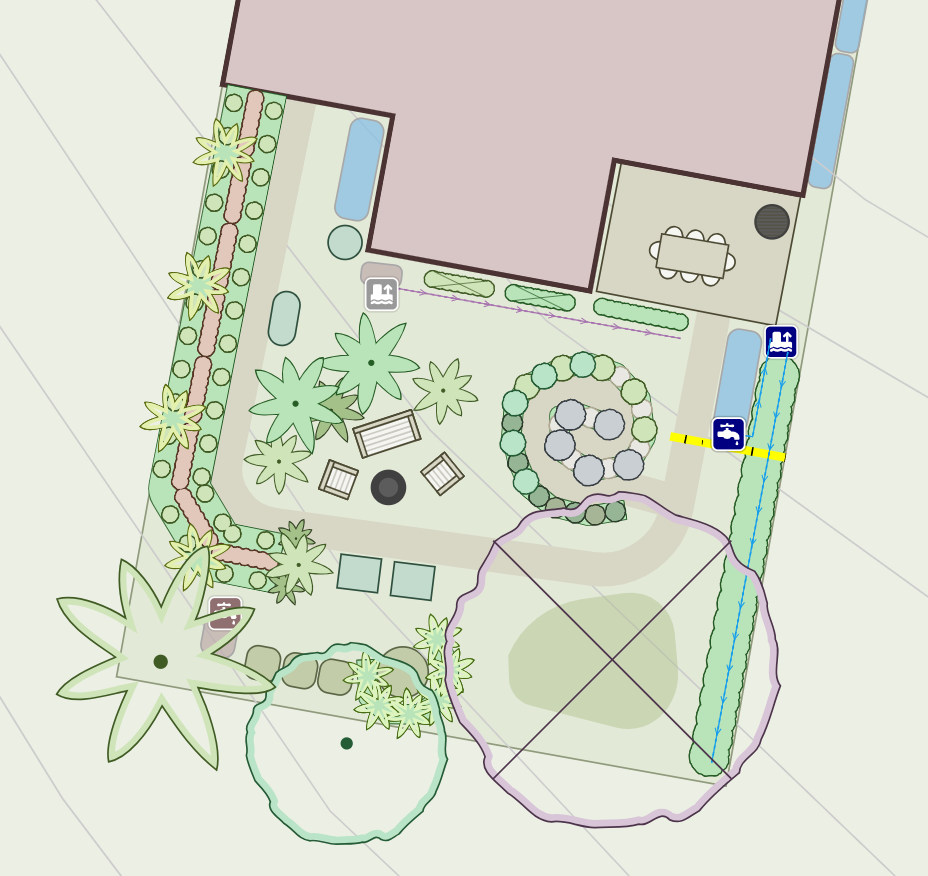
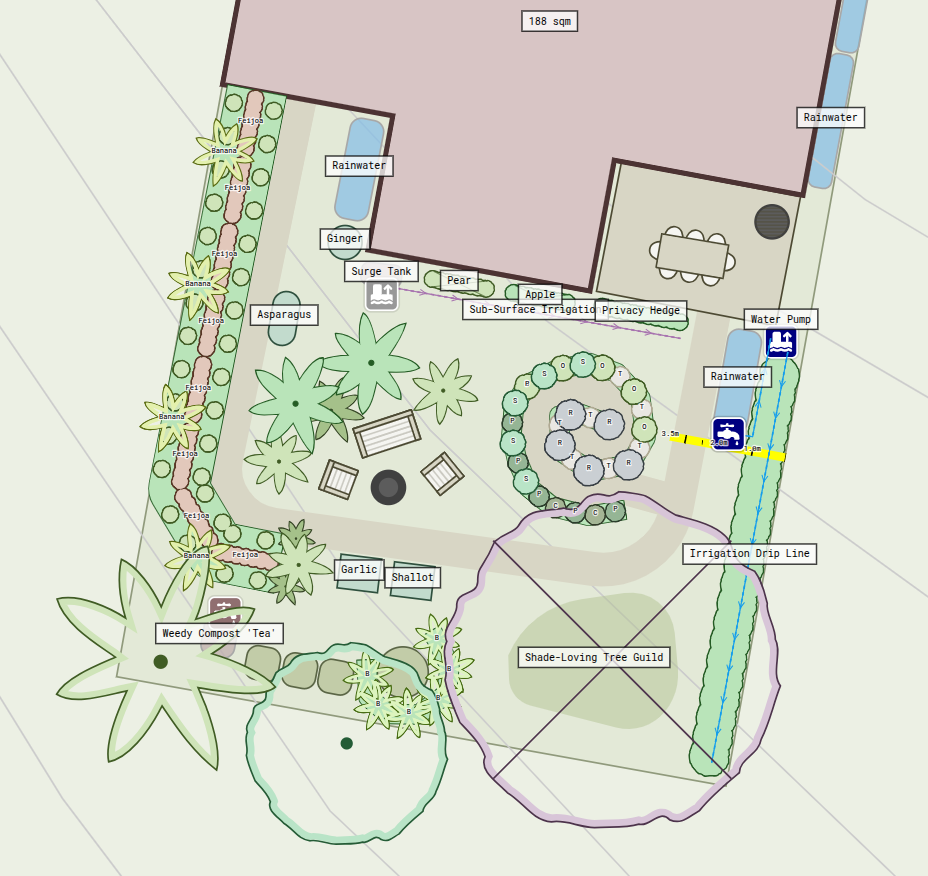
In the example images below, we show the design drawing without and with labels. We filled out the Label attribute of objects we wanted to describe and then used the label toggle in the top-right corner. To further improve readability of the design, we used the label style toggle button located in the same menu bar.
Toggle Drawing to Greyscale
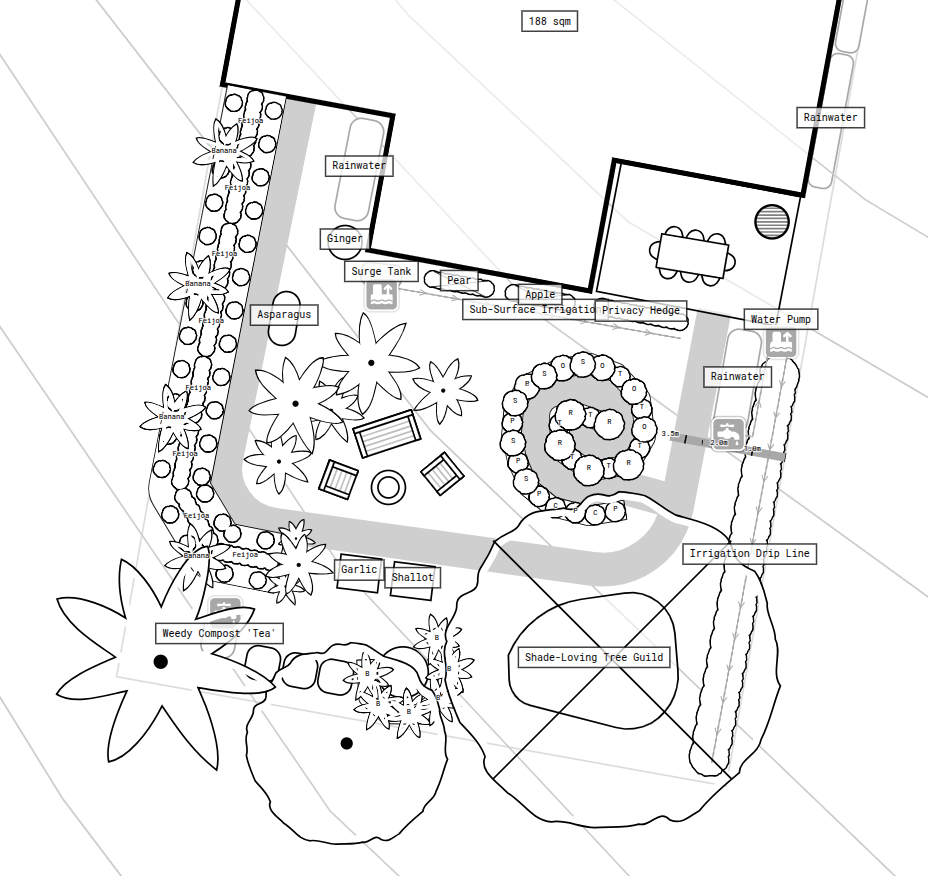
Convert your design to greyscale using the palette button in the top-right corner to produce high-contrast, black-and-white prints.
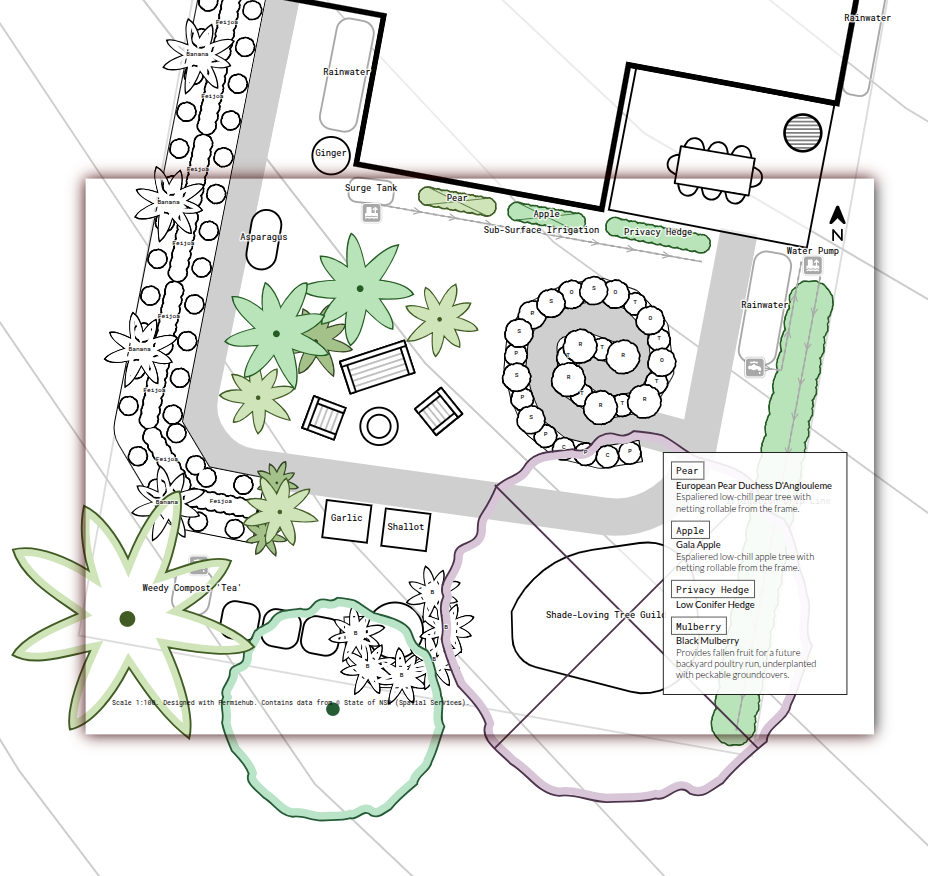
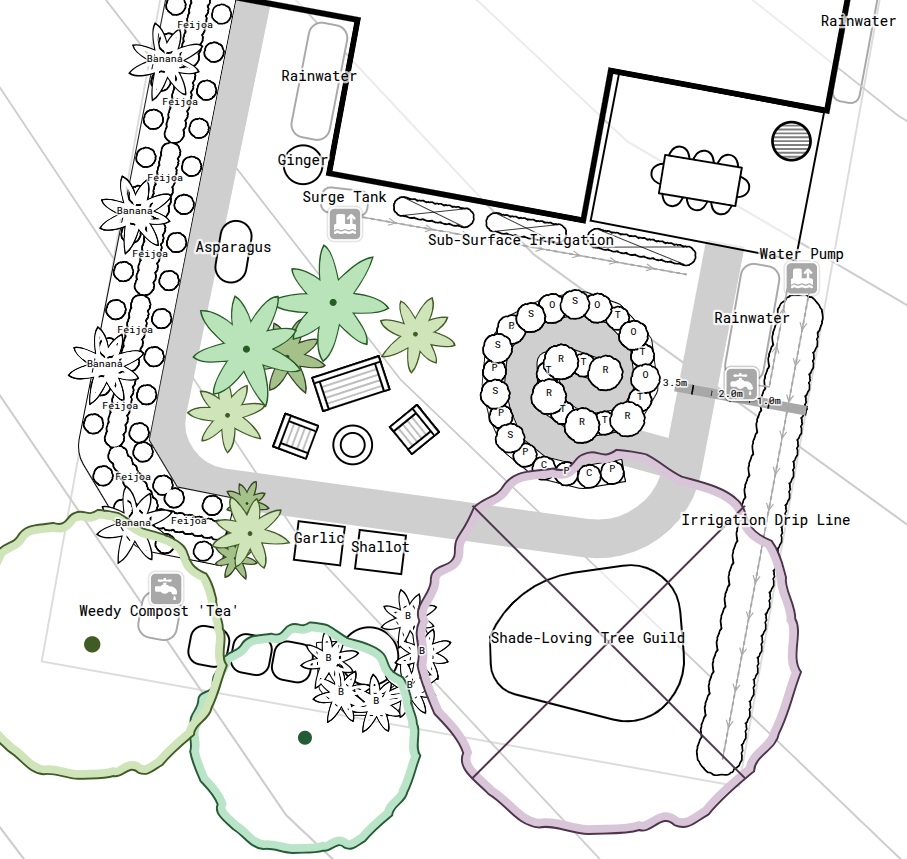
Example of Converting Site Plan to High-Contrast Greyscale in Permiehub
In the image below, we used the greyscale toggle button to make the drawing suitable to print without colour, making it clearer to read or sketch onto in the field.
Generate Planting Legend
A legend can be either a separate PDF file or included inside your drawing when using the Download to Print tool.
To generate a legend overlapping the drawing on the generated PDF file, make sure the On-Page Legend option is set to Visible.
Frame the area of your planting by moving the selection rectangle around the canvas. The legend only contains objects inside the selection area.
After framing the right area on your drawing, ensure the selection criteria under Items Must Have match the information you filled out about your plants.
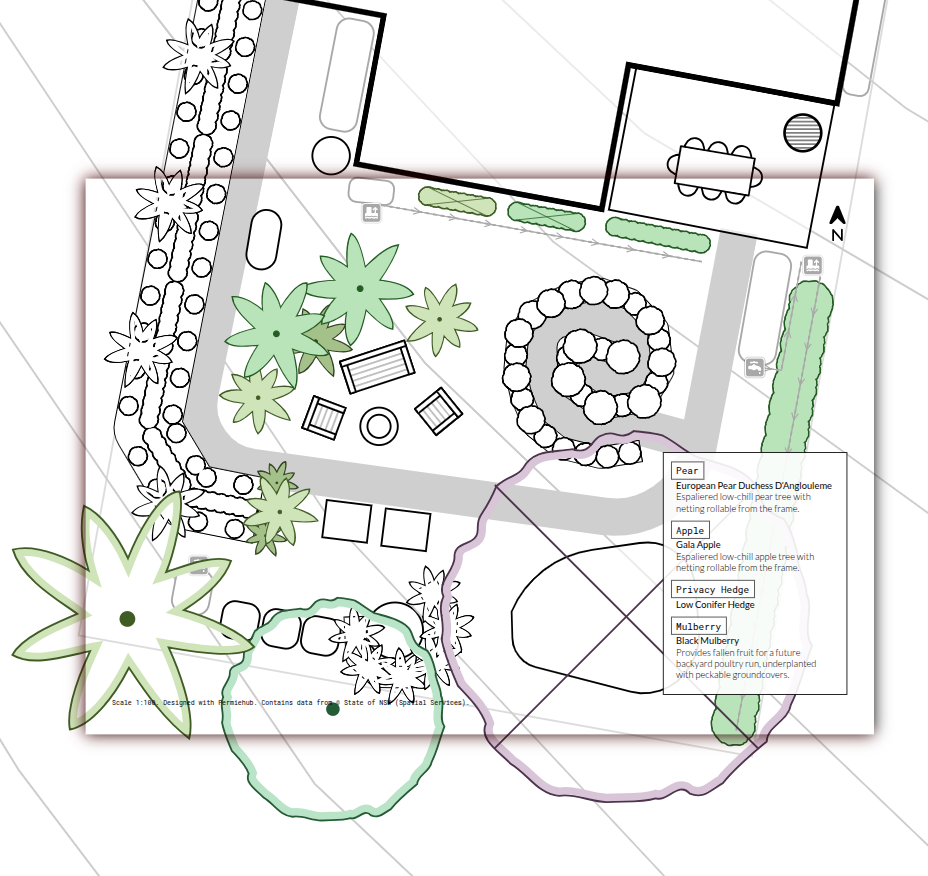
Example of Generating a Planting Legend in Permiehub
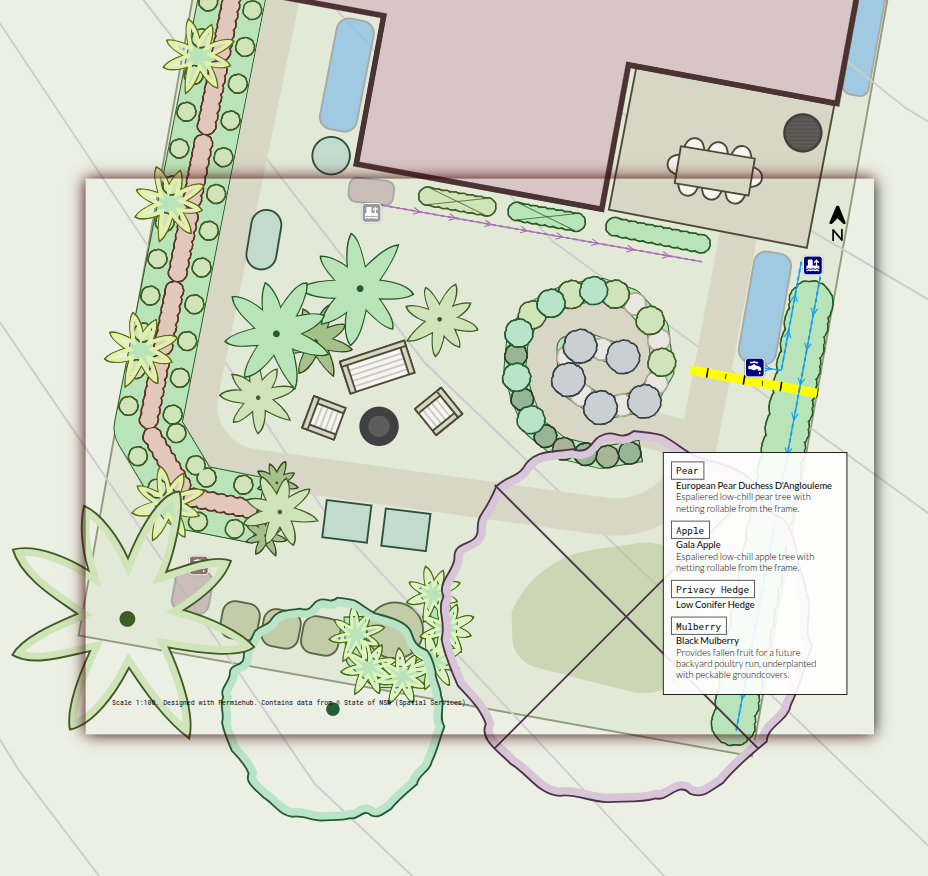
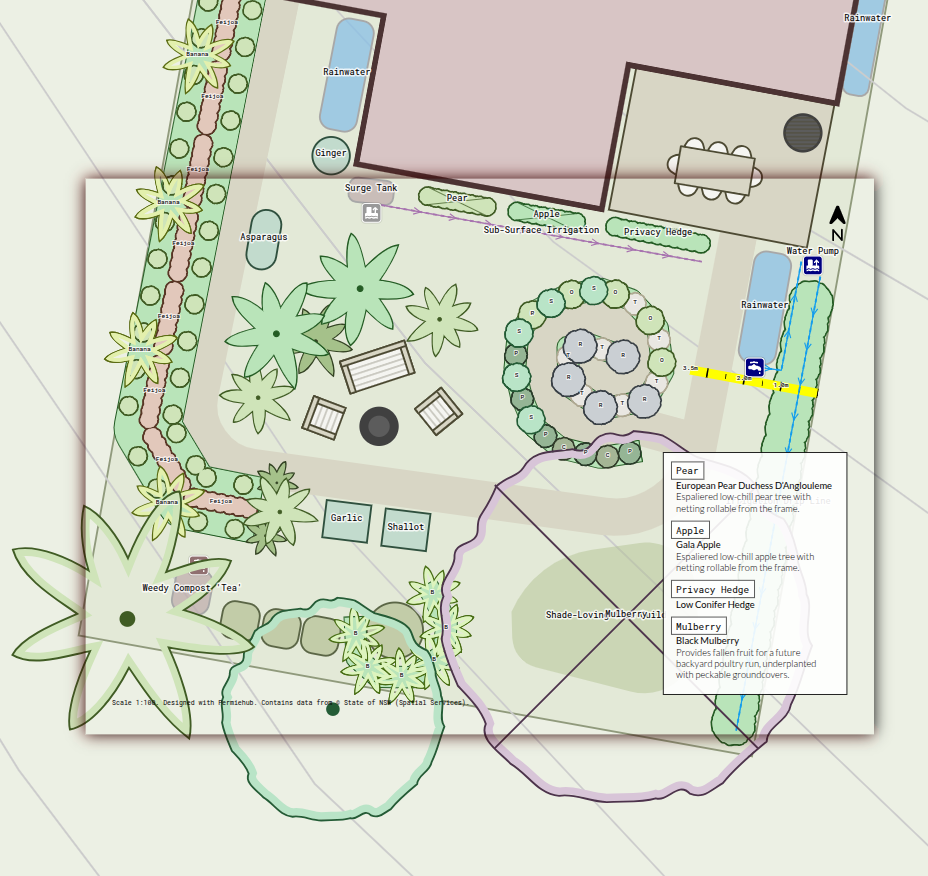
In the images below, we set Items Must Have to Label and Name. We ensured all items we wanted to include in the legend had this information set. We set the Marker to match the item Label values, Heading to display their Name attribute, and Paragraph to hold item Descriptions where available. Additionally, in the third image, we displayed the framed labels on the canvas itself by setting Label Style to Text in Rectangle. Alternatively, we could toggle the label style button in the top right corner of the canvas.
Use Custom Filters
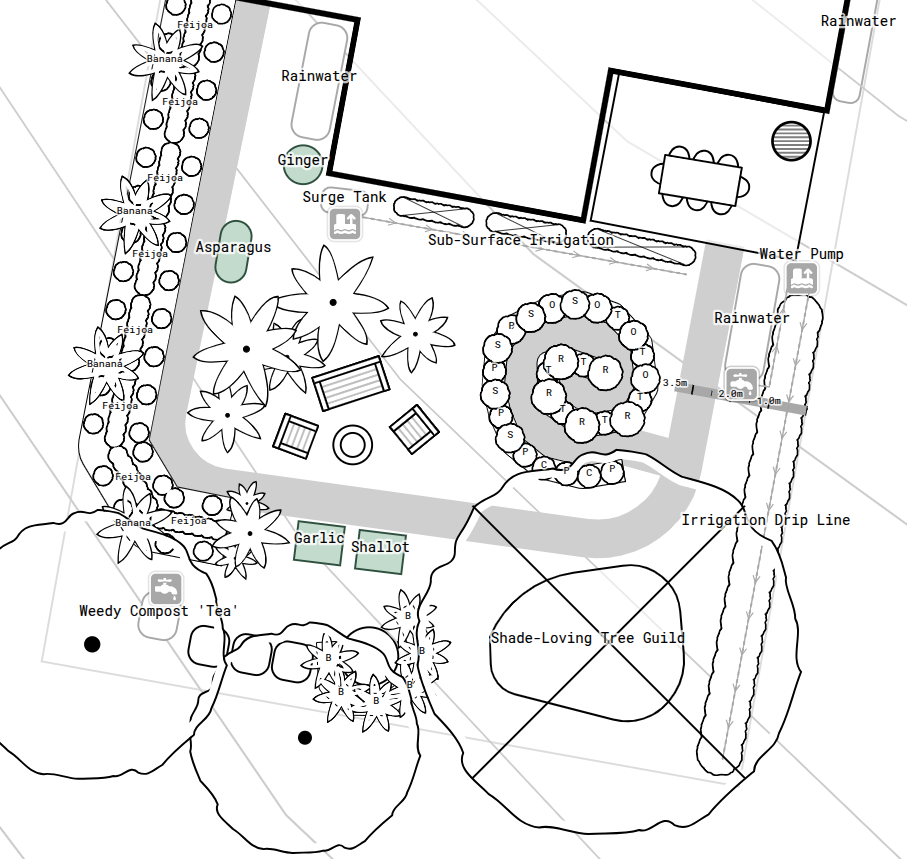
Custom filters allow you to hide objects or whole overlays selectively and drain them of colour using their filterable attributes. We used custom filters in previous examples to make planned changes stand out on top of a greyscale background. To enable custom filtering and explore all layout options, click the filter funnel icon in the top right corner of your drawing canvas.
Example of Combining Custom Filters with a Planting Legend in Permiehub
In the images below, we followed the steps outlined in generating a planting legend. Additionally, we used custom filters to drain colour from all items other than our Plant objects.
Never Forget What You Have Planted
- Faded tags and lost labels make tracking your garden frustrating. In the excitement of planting, cultivar names and dates are easily forgotten. Map your plants online to preserve your site history, track seasonal yields, and share your growing knowledge with confidence.
- Start Trial Today