Drawing Site Analysis Markers
Learn how to document site features using spot, area, directional, and corridor markers. Discover step-by-step instructions for placing symbols, customising shapes, adjusting dimensions, and applying colours to organise your observations.
Drawing Site Analysis Markers Step by Step in Permiehub
Browse the examples below to see how you can digitally record and visualise key observations, site features, and environmental factors using site analysis markers in Permiehub, software built specifically for permaculture.
If you are ready to start mapping your observations right away, head straight to Step 1: Select & Place Marker.
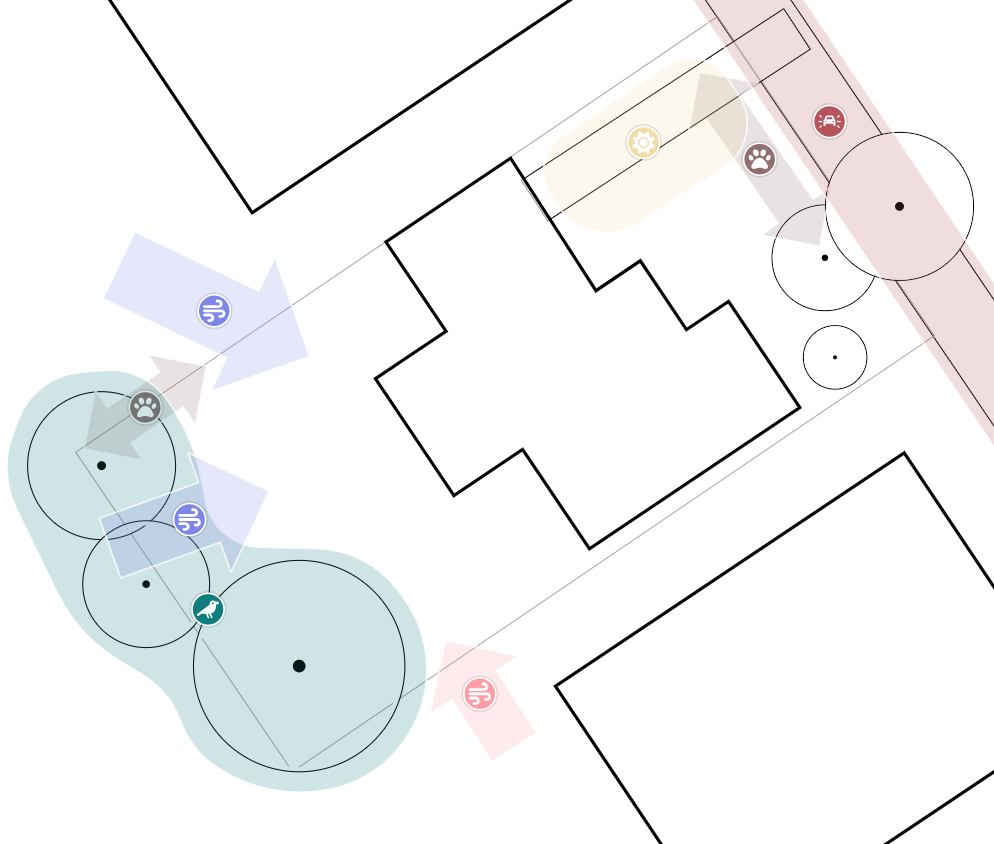
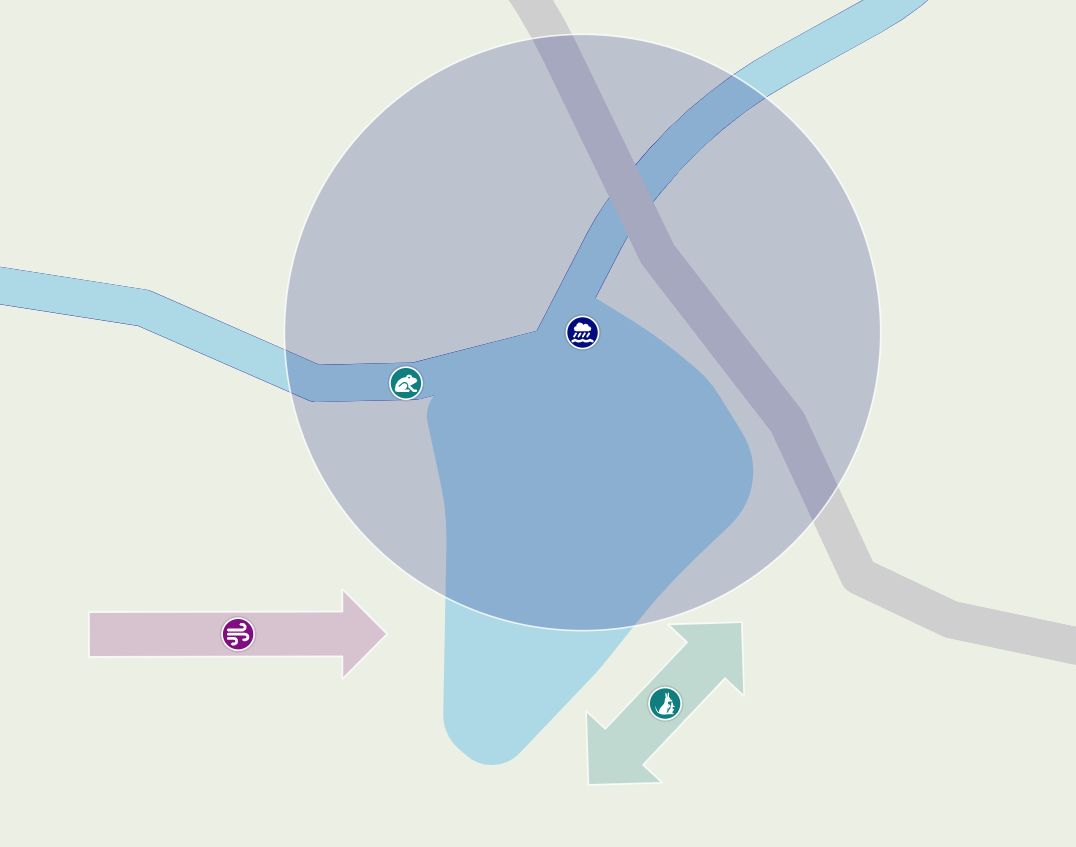
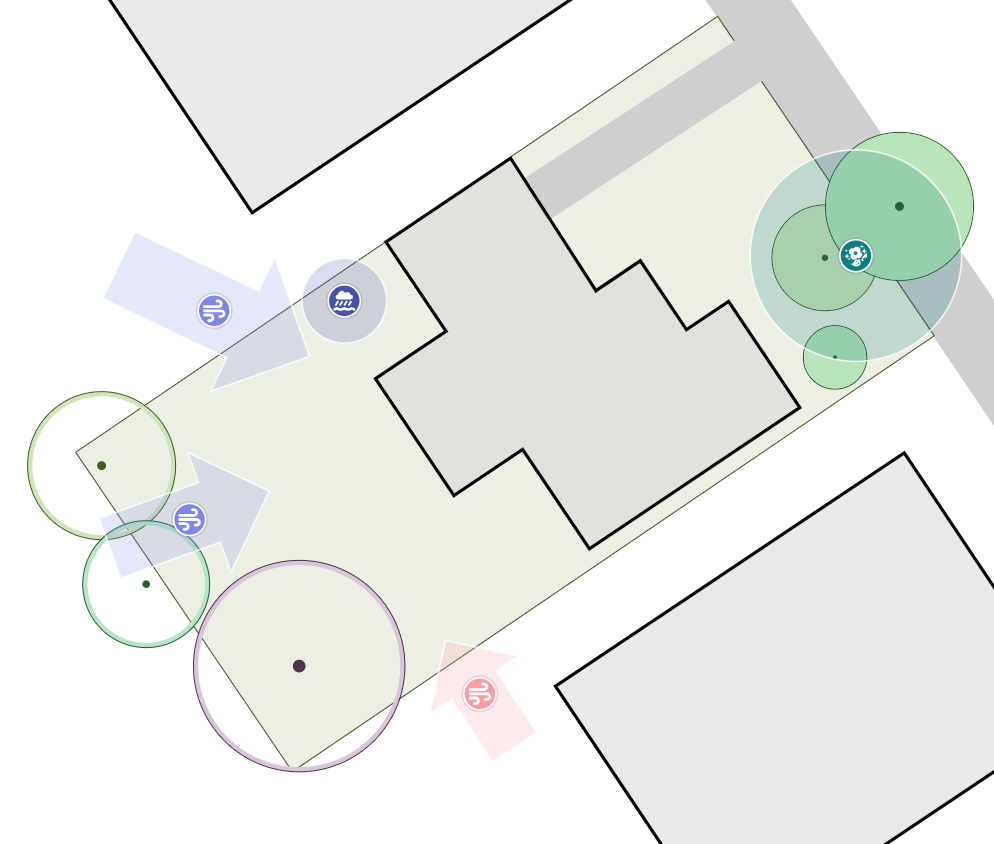
Our Goal
The following content helps you use the tools in the Site Analysis overlay. We aim to show how to create markers to record spots, areas, directions, or corridors for your observations. We cover the various shapes available for these markers, along with how to change their colour, icon, name, label, and shape. You will also learn how to create an area marker with a custom shape, including how to modify rectangles to give them curved sides.
Working with Permaculture Site Analysis Markers
You can use markers to highlight interesting features you observed on the property and want to address later in your Concept Design. These could be site features that present opportunities for improvement, or highlights you might want to enhance as you continue with your drawing. In Permiehub, categories of site analysis tools organise seasonal or permanent observations you might want to mark out, including
- weather and elements,
- sun exposure levels,
- fauna and flora affecting the site,
- recreational and other human activity,
- and soil types.
There are a few different ways to visualise your observations, depending on how you want to capture them, such as areas, spots, directions, and corridors.
Alternative Tools
Markers are tools in the Site Analysis overlay and are specifically suited for observations you make about the land you are designing. For static elements of the land, such as infrastructure lines, plantings, and buildings, you might want to use tools in the Base Map overlay instead.
Starting Point
To use markers in the Site Analysis overlay, you should have your editable project open. It helps to know the opportunities you have observed and want to address in the next stages of the design process. For inspiration and to help you find the right tools, the toolbox contains sections for different marker types you might want to apply to the land in your design.
Step 1: Select & Place Marker
The toolbox holds a large selection of marker presets you can choose from to record your observations in the Site Analysis overlay of your design. You can use the search field to look up markers by keyword.
Click the tool representing the observation you want to mark.
Click on the canvas to place the marker.
Continue placing more of the same marker, choose a different tool, or select a marker you have already placed.
Step 2: Adjust Marker Shape & Size
Depending on whether your observation represents an area or a point on the land, markers come with a default shape and size that you can change.
Change Marker Shape
By default, your marker has a specific shape preset for its type. The shape also affects how it resizes, as different shapes rely on different dimensions. Follow these steps to change the visual representation of your observation.
- Click to Select your marker.
- In its properties, edit and save a new value for the Shape attribute.
Example of Customising the Shape of Markers in Permiehub
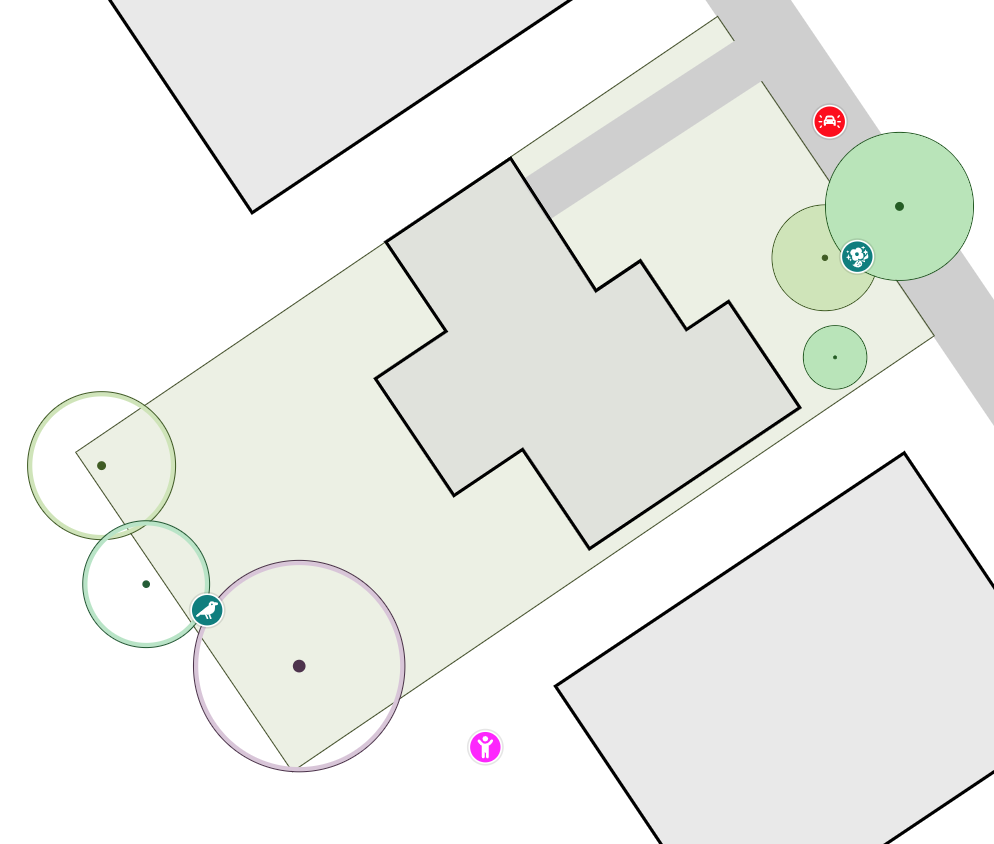
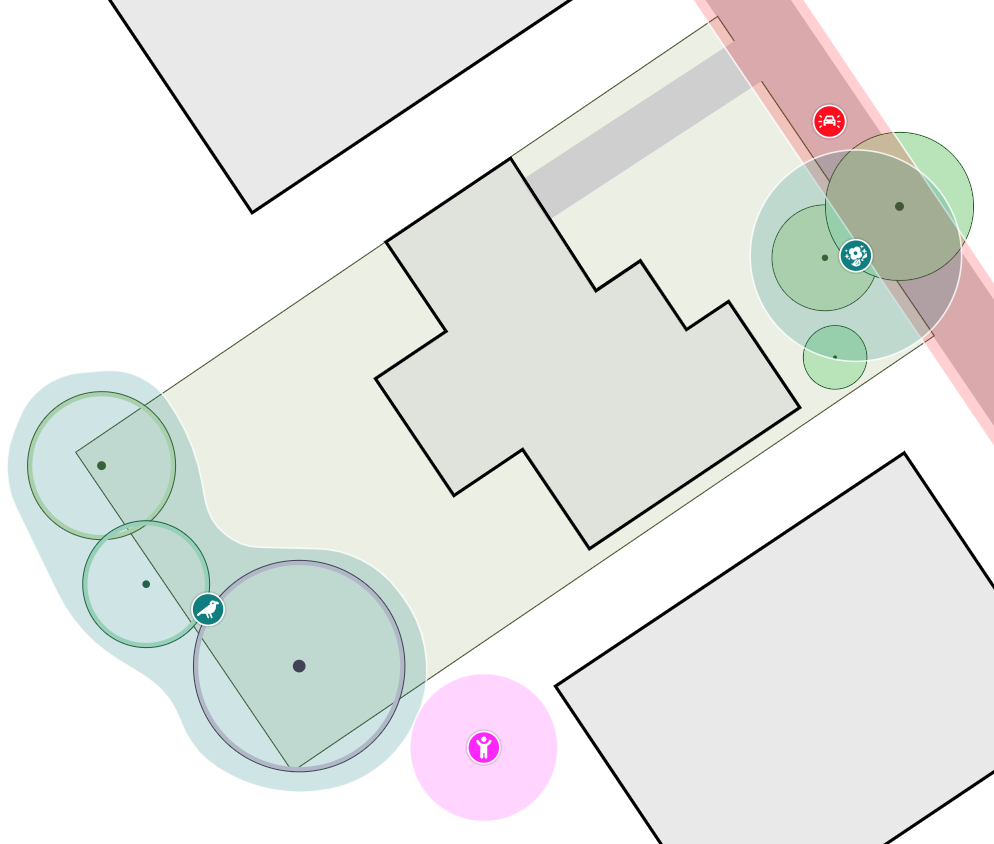
In this example, we placed markers for favourite spots for birds, street traffic, the neighbours’ trampoline, and beautiful blossoms. We marked these to protect positive aspects and improve areas where opportunities exist.
To capture these observations better in our design, we changed the default tool shapes. We used the Circular value of the Shape attribute for the beautiful blossoms and the trampoline, and Custom for the traffic and wildlife sanctuary.
Change Marker Size
The shape of a marker determines how you can change its size. Not all marker types can be resized. For example, once you change the shape to the Icon option, any previously set size attribute is ignored.
Resize Circle Markers
If your marker uses the Circle shape, you can change its diameter.
- Click to Select your marker.
- In its properties, edit and save a new value for the Diameter attribute.
Example of Resizing Circular Area Markers in Permiehub
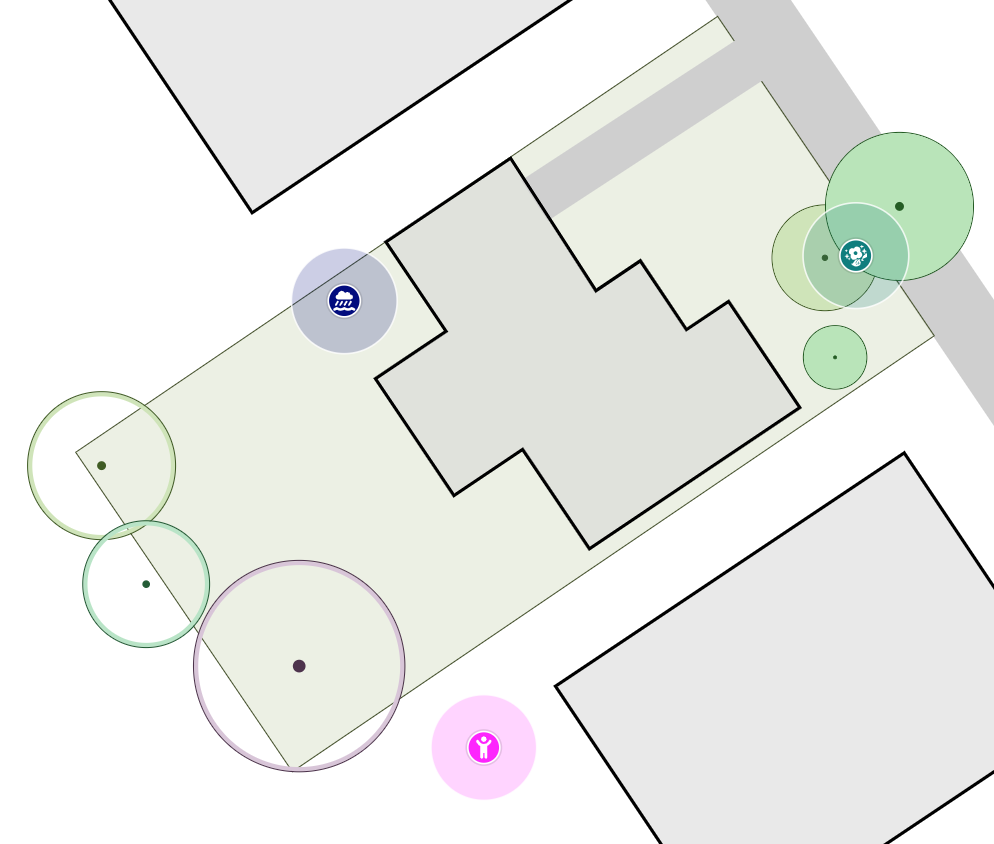
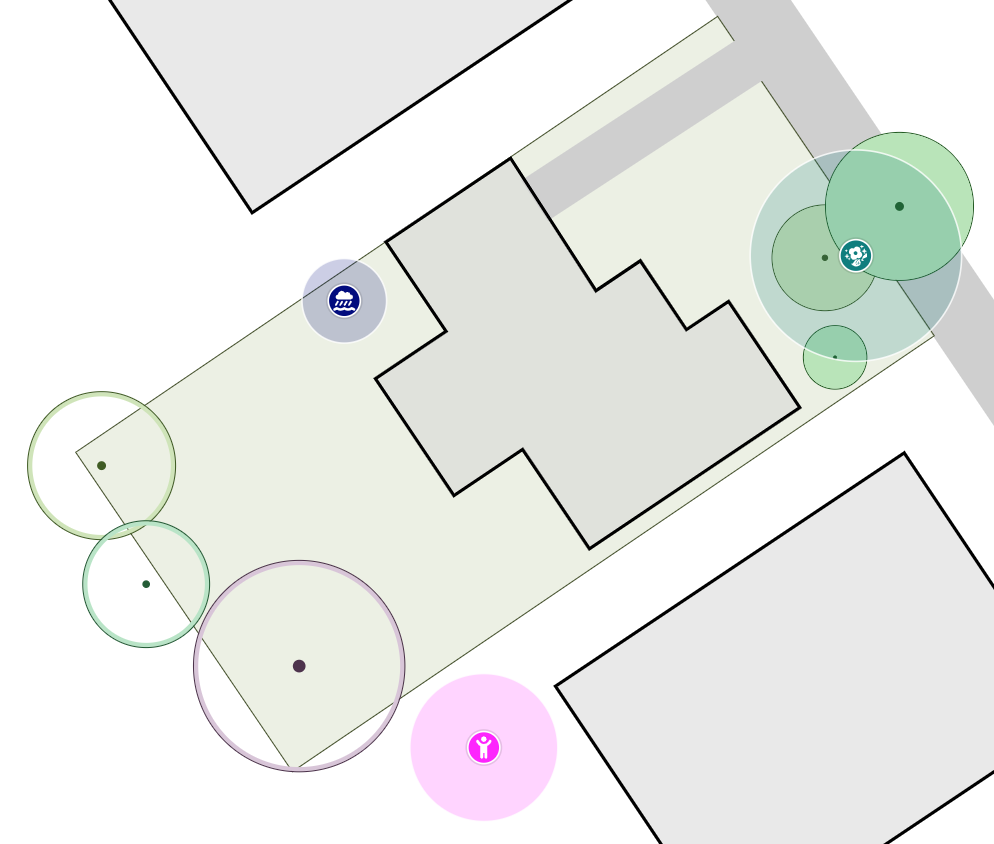
In this example, we wanted to resize the circular site analysis markers we used for a wet patch, beautiful blossoms, and the neighbours’ trampoline.
To make this change, we selected each marker and updated its Diameter. As a result, each marker now more accurately represents the area we need to mark.
Resize Arrow and Double Arrow Markers
For markers using the Arrow or Double Arrow shape, you can change both the length and the width.
- Click to Select your marker.
- In its properties, edit and save a new value for the Length attribute to adjust its length.
- In its properties, edit and save a new value for the Width attribute to adjust its width.
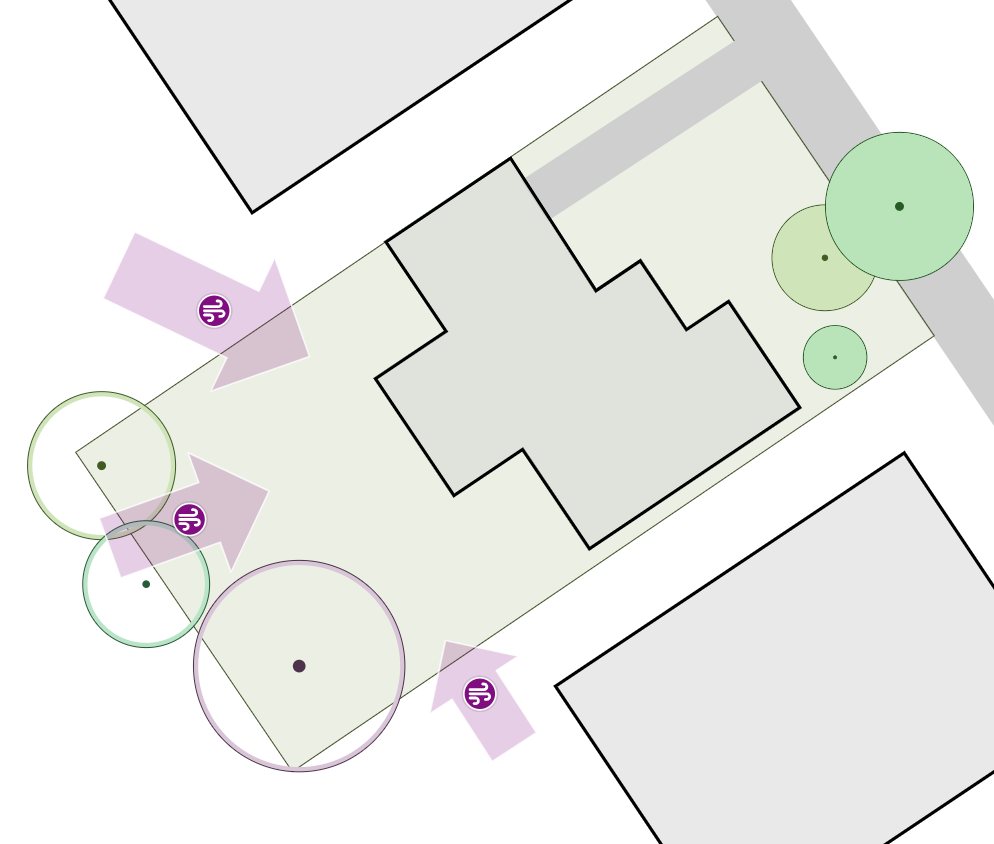
Example of Customising Prevailing Wind Markers in Permiehub
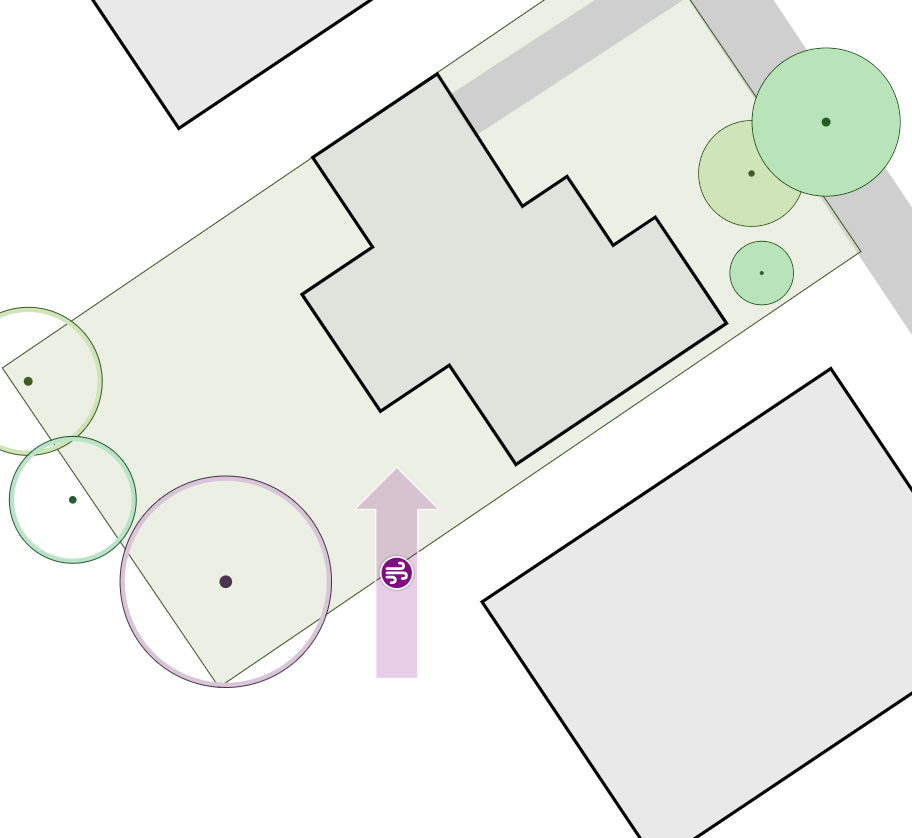
In this example, we marked prevailing winds observed on the property, especially where they pass through a wind tunnel.
We searched for wind to find the relevant tool. It includes an appropriate default icon and shape. After placing each marker, we selected it and used the Rotate button to set the correct position.
Resize Square and Rectangle Markers
For square or rectangular markers, you can change both dimensions.
- Click to Select your marker.
- In its properties, edit and save a new value for the Length attribute.
- In its properties, edit and save a new value for the Width attribute to adjust the second dimension.
Resize and Shape Custom Markers
Markers with their Shape attribute set to Custom allow you to change their appearance in the same way as other tools that create areas.
- Click to Select your marker.
- Either select the Edit Path tool from the toolbox or click a second time to enable it on your marker.
- Drag the corner points of the rectangle to make the area smaller or larger.
- To curve the corners of the area, drag the circular points away from the angle, increasing the curve radius.
- For a more complex shape, add points to the path by clicking along its straight sections. Drag them out to create extra corners for your area.
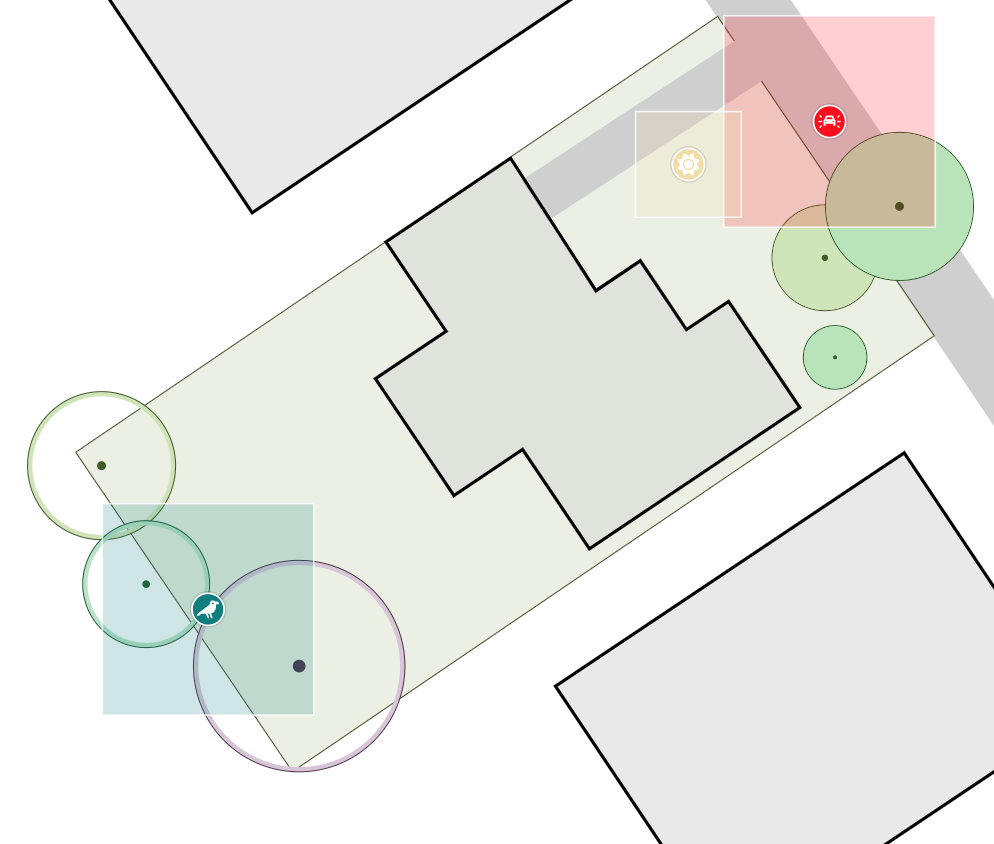
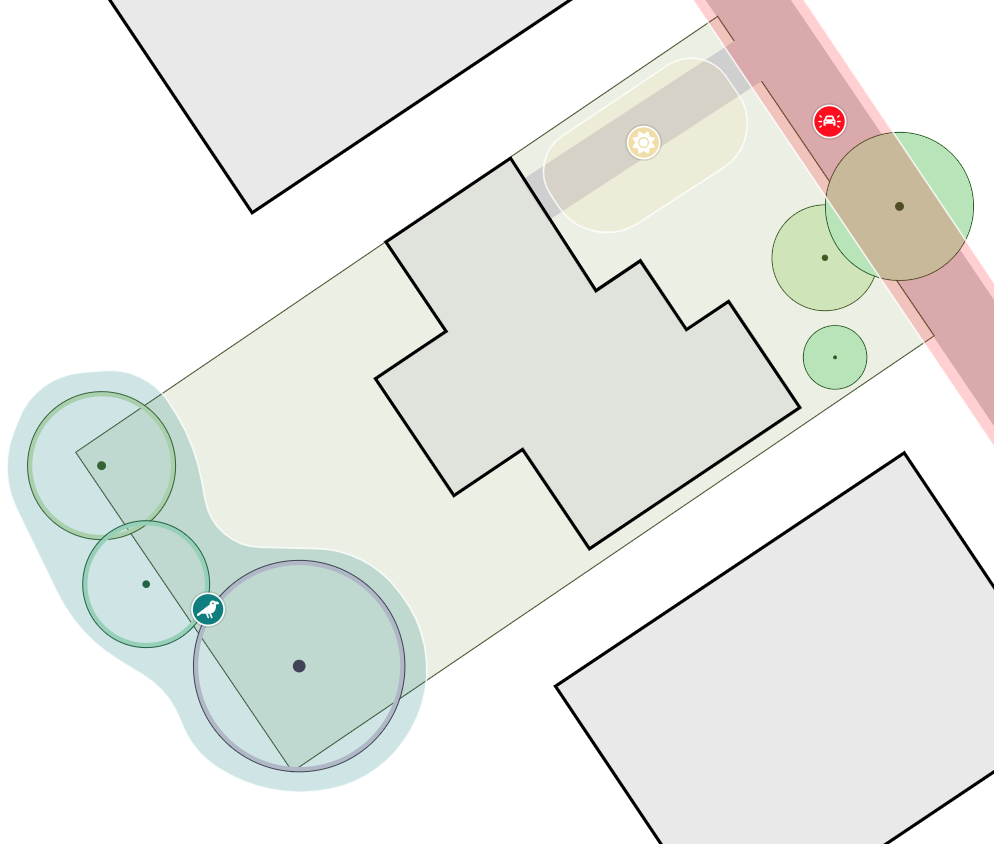
Example of Shaping Custom Markers in Permiehub
In this example, we decided to change the markers for the bird nesting area, full sun, and traffic. After changing the Shape attribute to Custom, the marker changed to display a surrounding rectangular area.
We then selected each marker and dragged its corner points into place. We added extra points and used the round curving points to create a complex wildlife area marker around the backyard trees.
Step 3: Customise Markers
In the previous step, we covered changing the shape or size of your marker. Other attributes you can modify include its colour, icon, name, and label.
Change Marker Colour
Changing the colour of a marker allows you to organise and colour-code your observations. For this purpose, we created categories that represent site analysis features as negative, neutral, or positive. By default, markers take the colour of the type they represent. Follow these steps to change the colour of your marker.
- Click to Select your marker.
- In its properties, edit and save a new value for the Colour attribute.
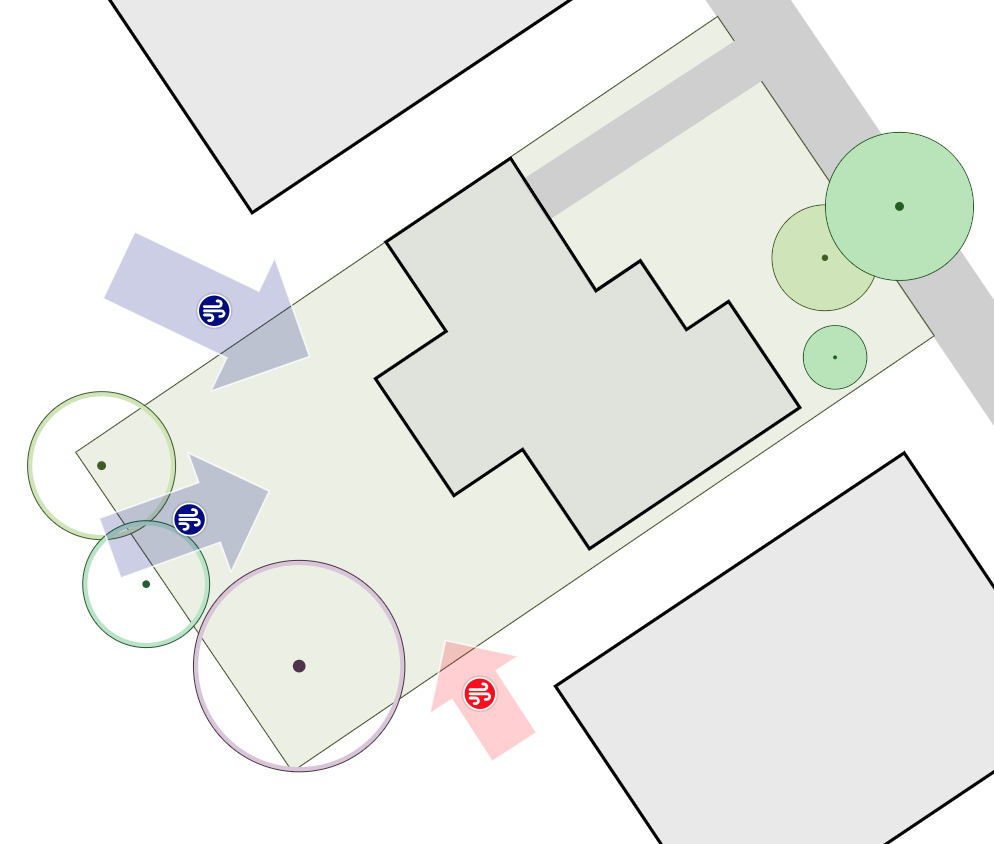
Example of Colour-Coding Prevailing Wind Markers in Permiehub
In this example, we wanted to highlight winter and summer prevailing winds separately. To symbolise warm summer air, we changed the Colour attribute of the directional marker on the right. Similarly, the other two markers were changed to blue to mark seasonal winter westerly winds.
Change Marker Icon
Marker icons correspond to tools in the toolbox. Once you have selected and placed a marker, you can change its icon at any time.
- Click to Select your marker.
- In its properties, edit and save a new value for the Icon attribute.
Change Marker Name
The name of a marker identifies your specific observation. Once you have selected and placed a marker, you can change its name at any time.
- Click to Select your marker.
- In its Display Info section, edit and save a new value for the Name attribute.
Add Labels to Markers
Adding a label to display on the screen alongside the marker is useful when you have a piece of information you want to show at all times.
- Click to Select your marker.
- In its Display Info section, edit and save a new value for the Label attribute.
Important
To view labels on your drawing, they must be enabled and large enough to see. Make sure the label toggle in the top-right corner of your canvas is turned on.
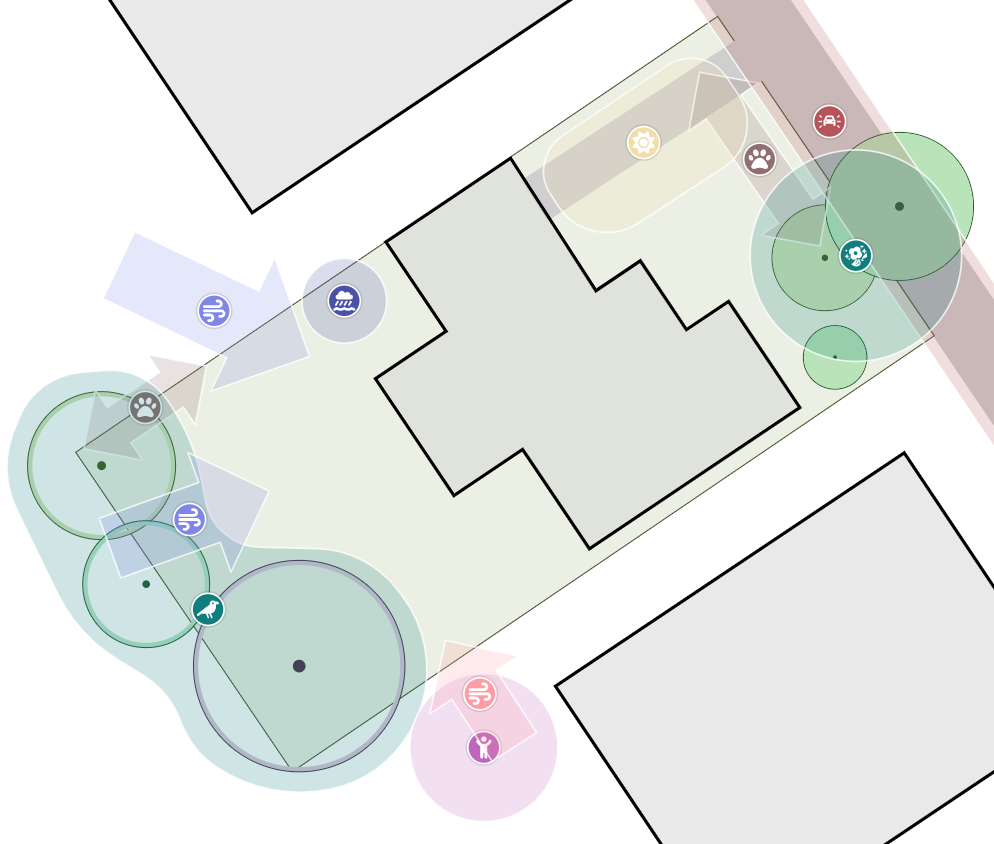
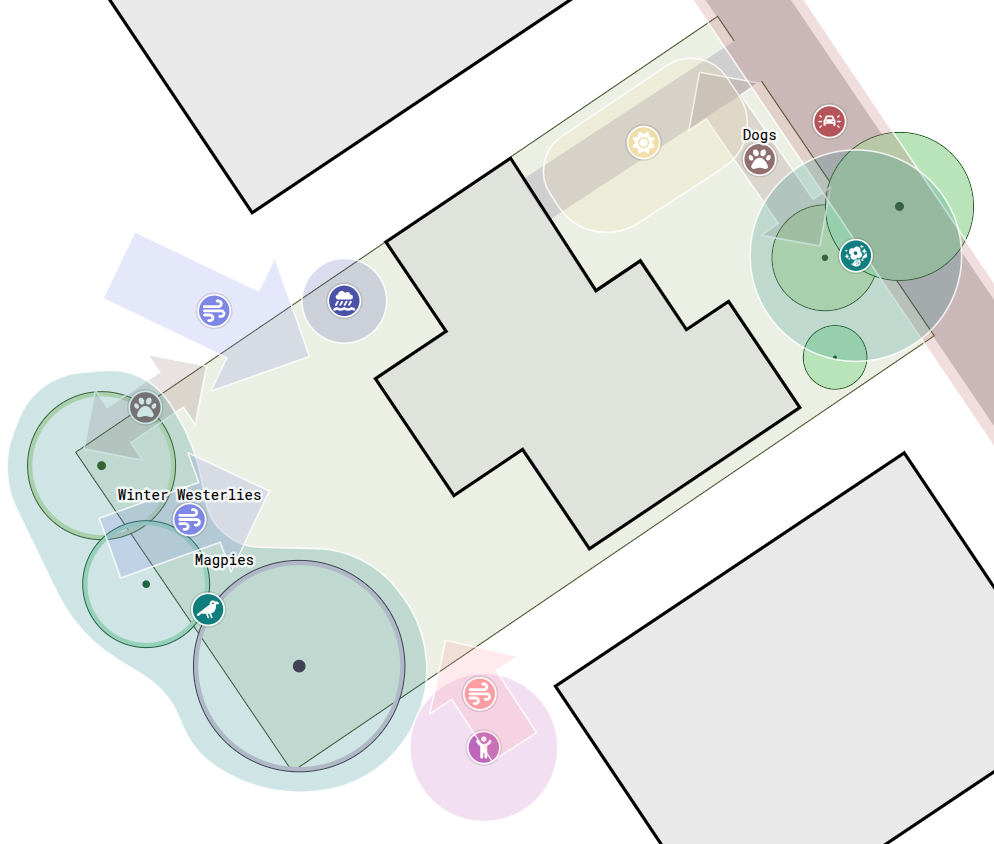
Example of Adding Labels to Markers in Permiehub
In this example, we wanted to add labels to some of our markers to convey more information directly on the drawing. To label the selected markers, we clicked each one and updated its Label attribute in its Display Info section.
Step 4: Reuse Marker Settings
Duplicate Markers
Once you have changed the colour, shape, name, label, or size of a marker, you can save time by duplicating the object instead of repeating those changes manually. To duplicate a marker, select it and click the Duplicate icon. Alternatively, press Ctrl+C and Ctrl+V, or Cmd+C and Cmd+V on your keyboard, depending on your operating system.
Change Marker Attributes in Bulk
On your computer, you can select items in bulk using the Shift key and change common attributes for all objects at once.
Step 5: Export Site Analysis Drawing
As with any step, you can choose to export your design as a PDF to share or print it. You might also want to do the same with your site analysis for ground-truthing. Choose the Download to Print tool to download your file. Before printing, consider enabling labels or toggling the design from colour to greyscale.
Enable Labels
To view labels, the label toggle in the top-right corner of your canvas must be enabled. You can click Enlarge Labels or Shrink Labels to adjust their size.
Toggle Drawing to Greyscale
Toggling your design to greyscale can improve readability, especially when printing. You can switch between full-colour and greyscale options by clicking the toggle in the top-right corner of your canvas.
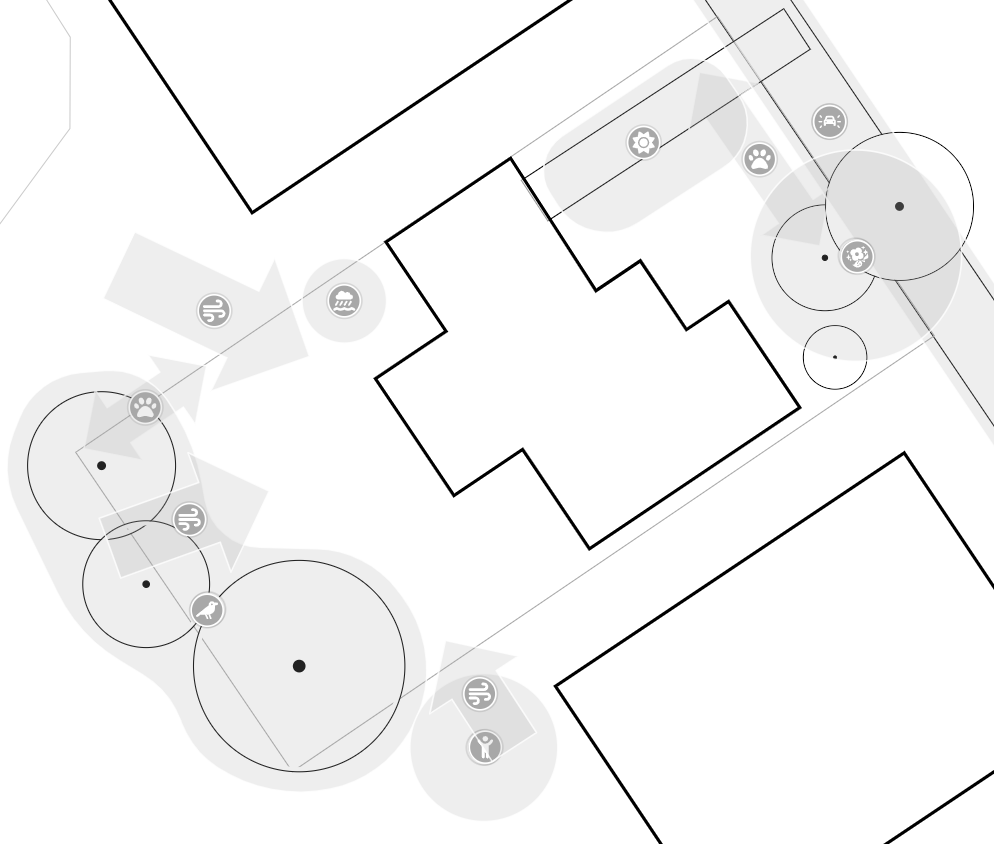
Example of Toggling the Drawing to Greyscale in Permiehub
In the example below, we disabled colours in the drawing to make it easier to print. We clicked the colour toggle in the top-right corner of the canvas to display the entire drawing in greyscale.
Toggle Markers to Greyscale by Shape or Colour
To selectively modify elements on your design drawing, Permiehub offers a custom filter toggle in the top-right corner. Once enabled, you can choose to drain colour or hide elements by their selected attributes. For site analysis markers, you can use their Shape and Colour values.
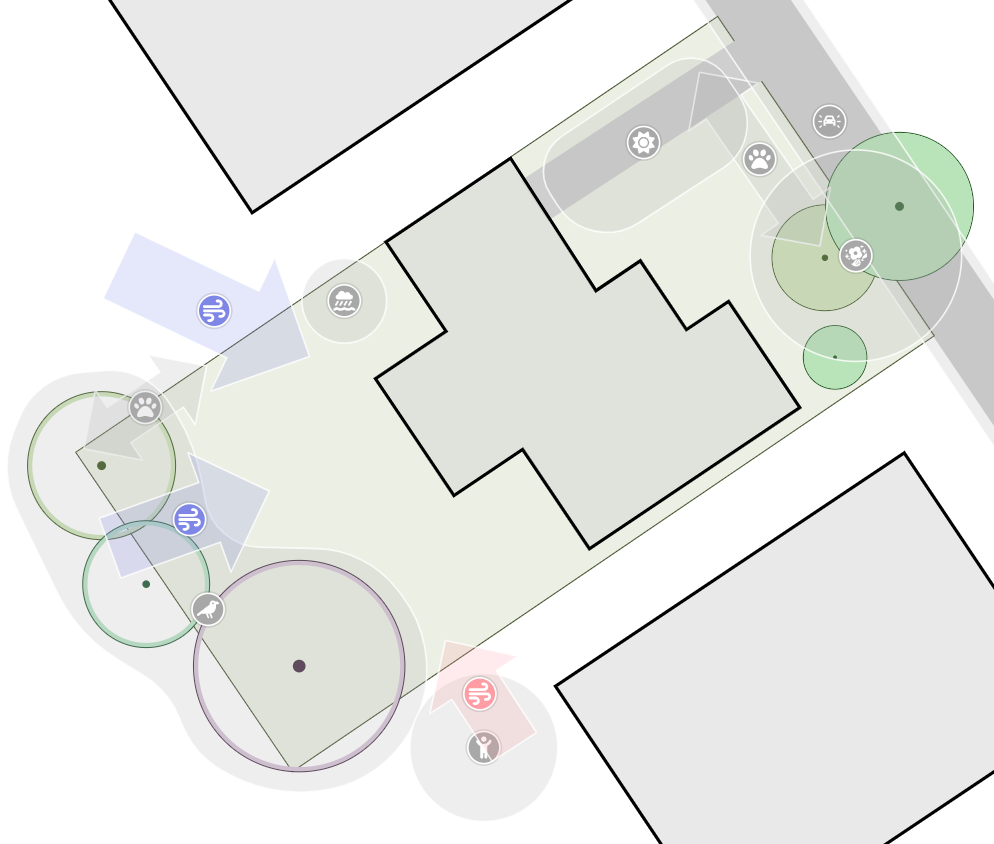
Example of Using Custom Filtering to Drain Colour of Markers in Permiehub
In this example, we wanted to drain colour from markers other than the arrow. In the top-right corner, we enabled custom view filtering. We expanded the Site Analysis, Site Markers, and Shape sections. Then we clicked the palette icons next to shape types other than Arrow.
Hide Markers by Shape or Colour
Similar to toggling selected markers to greyscale using the custom view filter toggle, you can use object attributes to hide them from the drawing completely. For markers, you can use their Shape and Colour attributes to do so.
Example of Using Custom Filtering to Hide Markers in Permiehub
In this example, we wanted to display directional and circular markers on the drawing, except for the neighbours’ trampoline marker. In the top-right corner, we enabled custom view filtering. We expanded the Site Analysis, Site Markers, and Shape sections. Then we clicked Arrow and Circle, which automatically deselected all other markers. To hide the trampoline, we expanded Colour and toggled all but that marker’s colour on.
Design with Nature, Not Against It
- Every observation you make belongs on your map. Bring your sun, wind, and soil insights together on your Permiehub canvas to build a design that works in harmony with your site.
- Start Trial Today