Generate Contour Maps Anywhere in the World
Understanding topography is fundamental to designing homesteads, regenerative farms, and permaculture properties. In this guide, we show you how to generate contour maps anywhere in the world in seconds with Permiehub.
Add Contour Maps in 3 Easy Steps
1. Search & Frame
In Permiehub's Base Map Wizard, type any address and frame your land.2. Select Layers
Choose a contour interval and additional layers like aerial imagery, roads and waterway.3. Load Data
Confirm selection to add data to your project and start designing.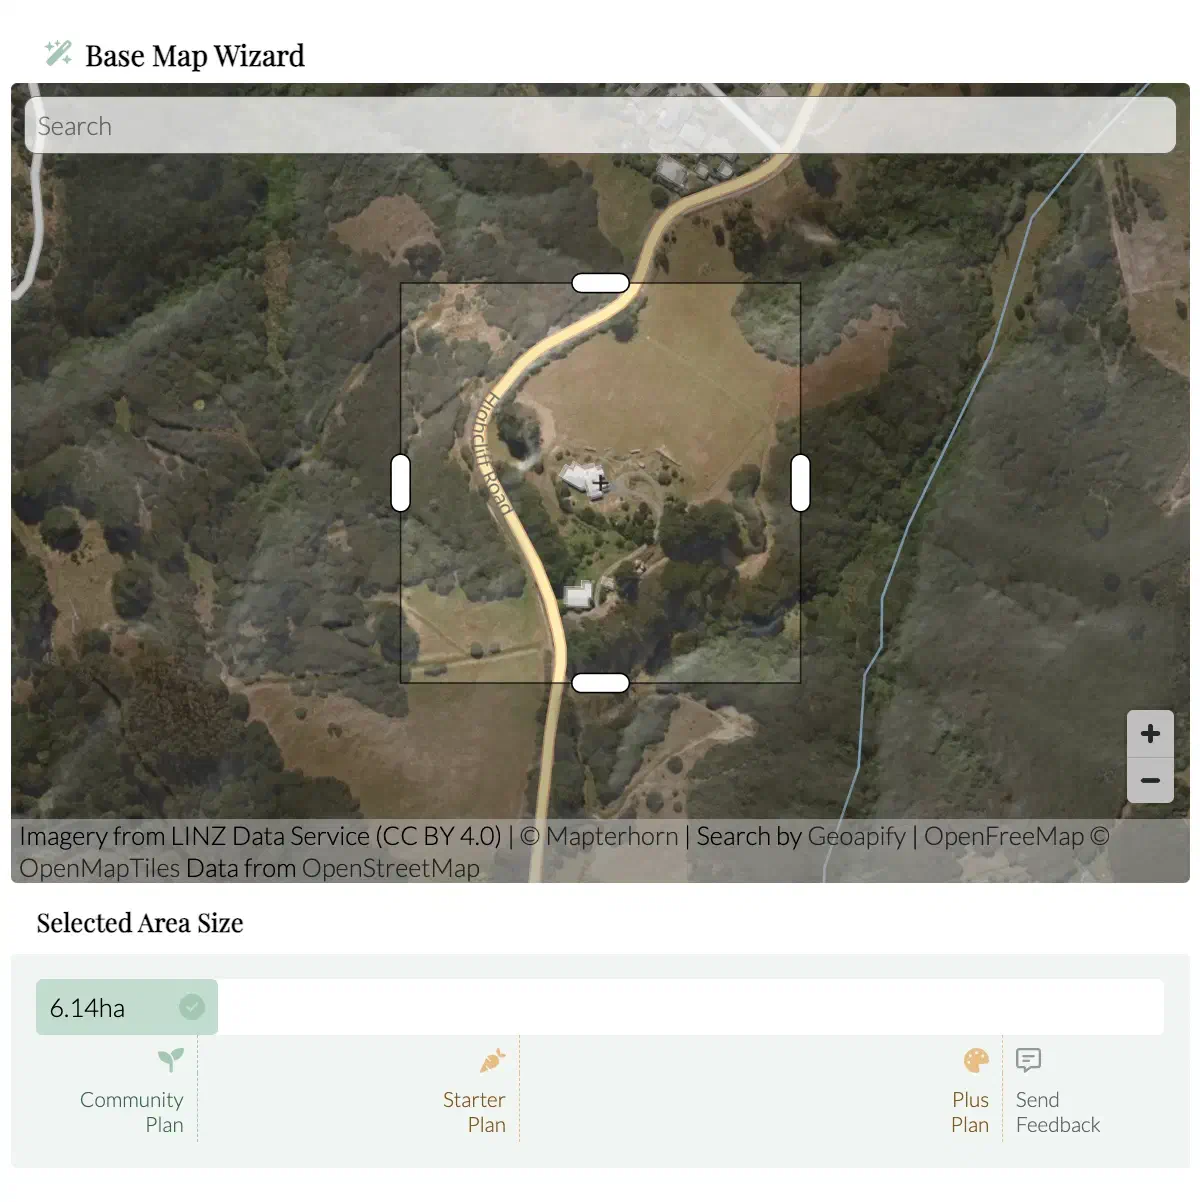
1. Search any address and frame your land.
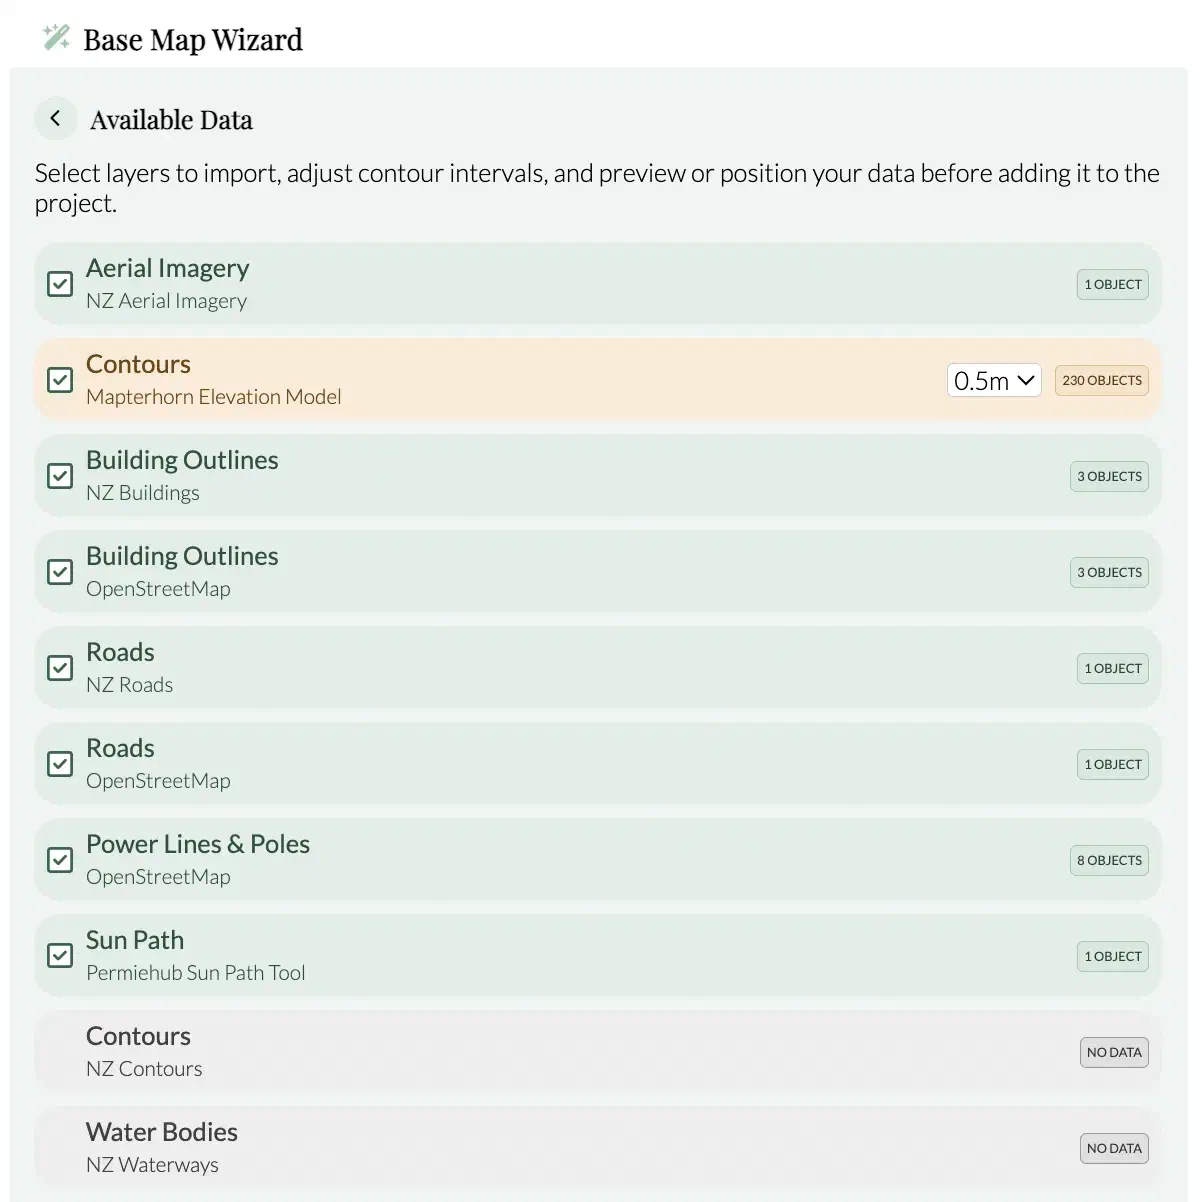
2. Select your preferred contour interval and desired feature layers.
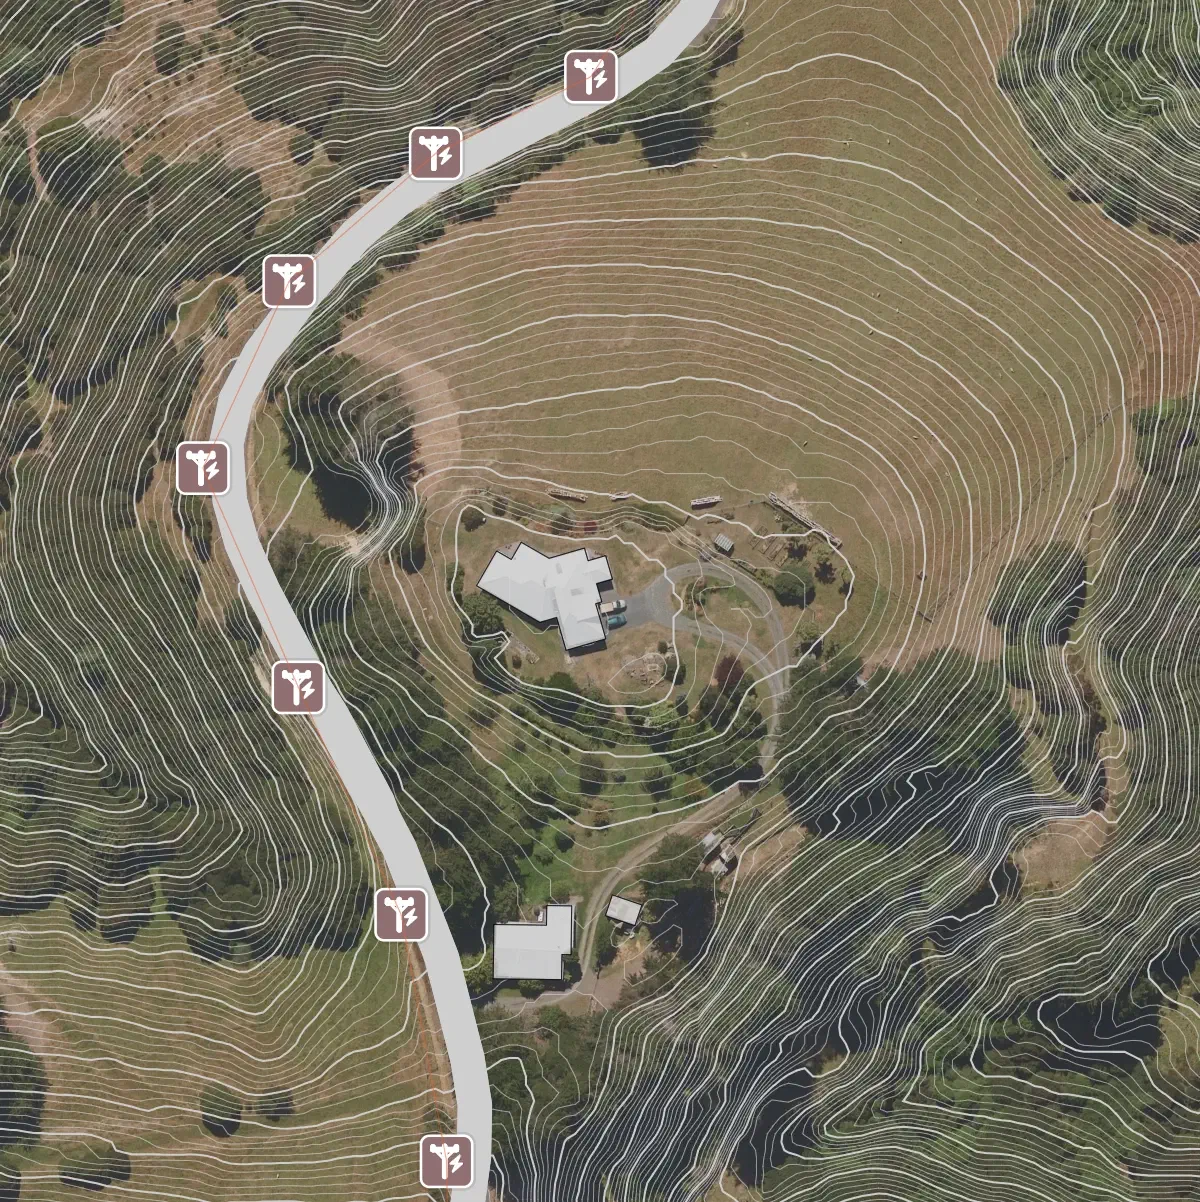
3. Instantly load scale-accurate contours, satellite imagery, and more into your project.
How Topography Shapes Better Land Design
Across broadacre regenerative farms, agroforestry systems, and permaculture homesteads alike, ecological land design starts with evaluating landscape topography. Slope, aspect, and elevation dictate how water moves across the surface, where cold air pools in valleys, how wind travels over exposed ridges, and where sunlight falls throughout the seasons.
Accurate contour lines turn an abstract aerial photo into an actionable terrain map of your site. Using precise contour maps for permaculture design and whole farm planning allows designers and land stewards to make informed decisions about:
- Water harvesting & infiltration: Where to position on-contour swales to slow, spread, and sink rainwater into the landscape, recharging groundwater and preventing nutrient run-off.
- Functional site capability & zoning: Which areas are prone to erosion and which are suited to market gardens, orchards, access paths, house sites, and supporting infrastructure.
- Tree row & food forest alignment: How to orient agroforestry rows and shelterbelts along or off-contour to optimise moisture retention and access.
Note: While elevation contours in Permiehub are ideal for landscape layout, site analysis, and surface water management, specialised geotechnical engineering tools should be used for structural dam engineering and major cut-and-fill civil earthworks.
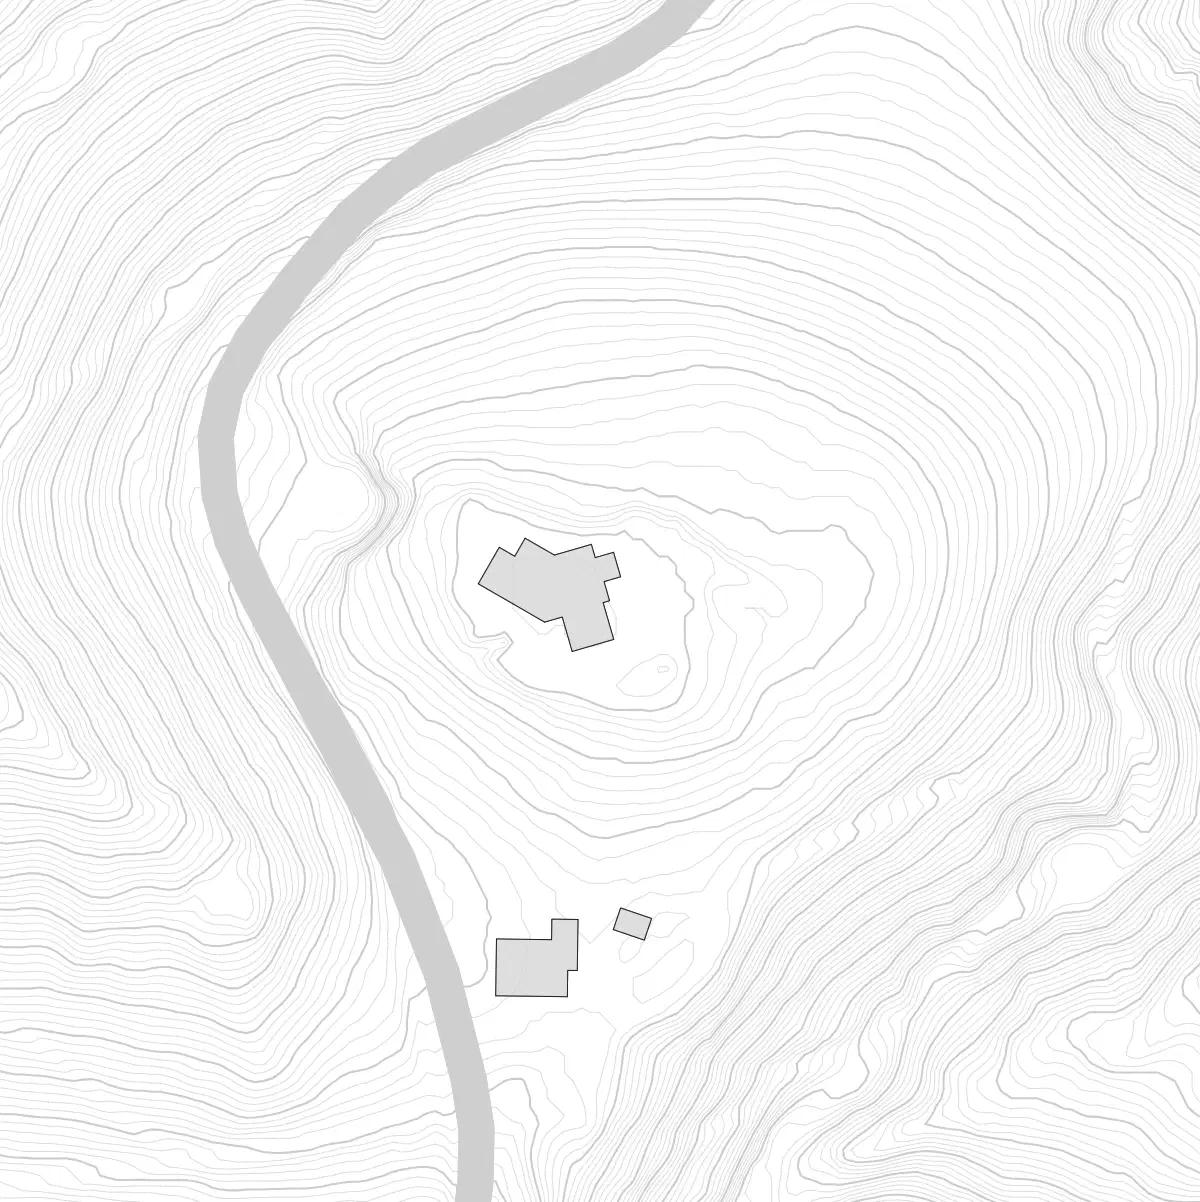
High-density 0.5metre contour lines along with the local road and building outlines.
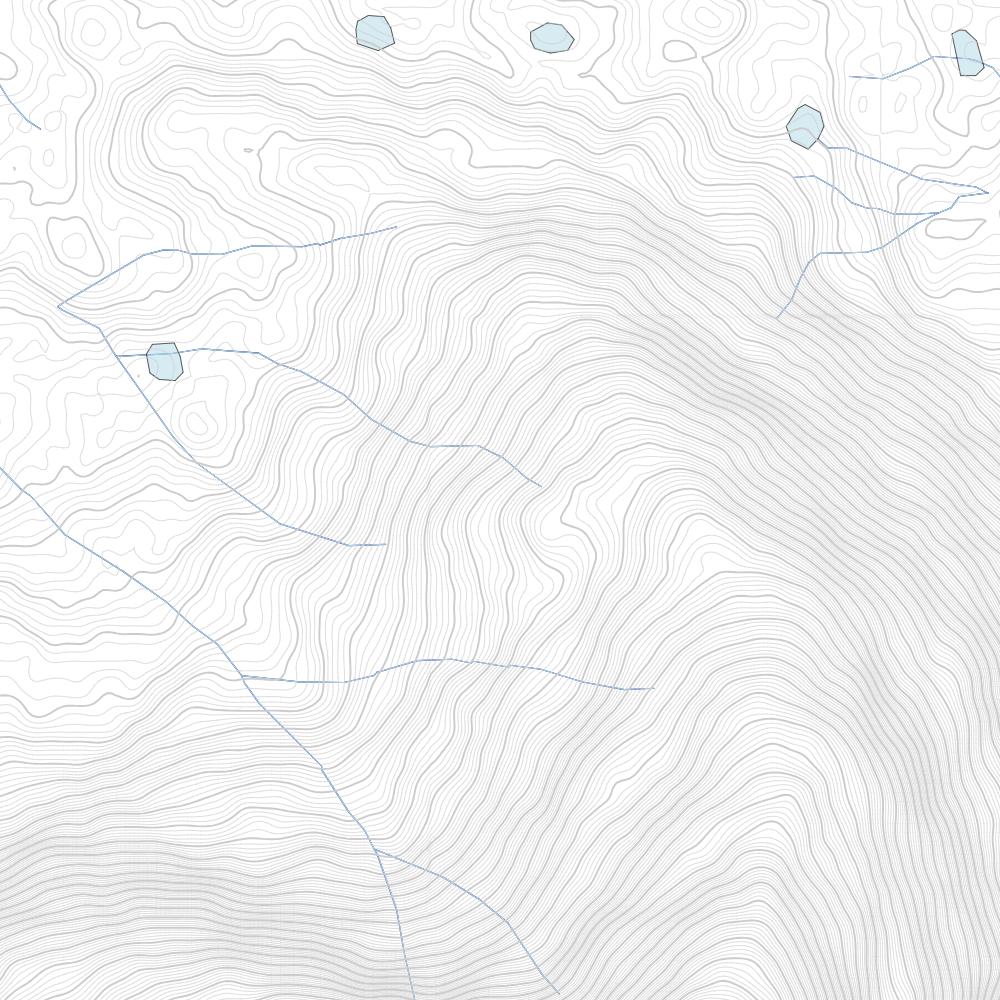
High-density 1-metre contour lines along with creeks and dams.
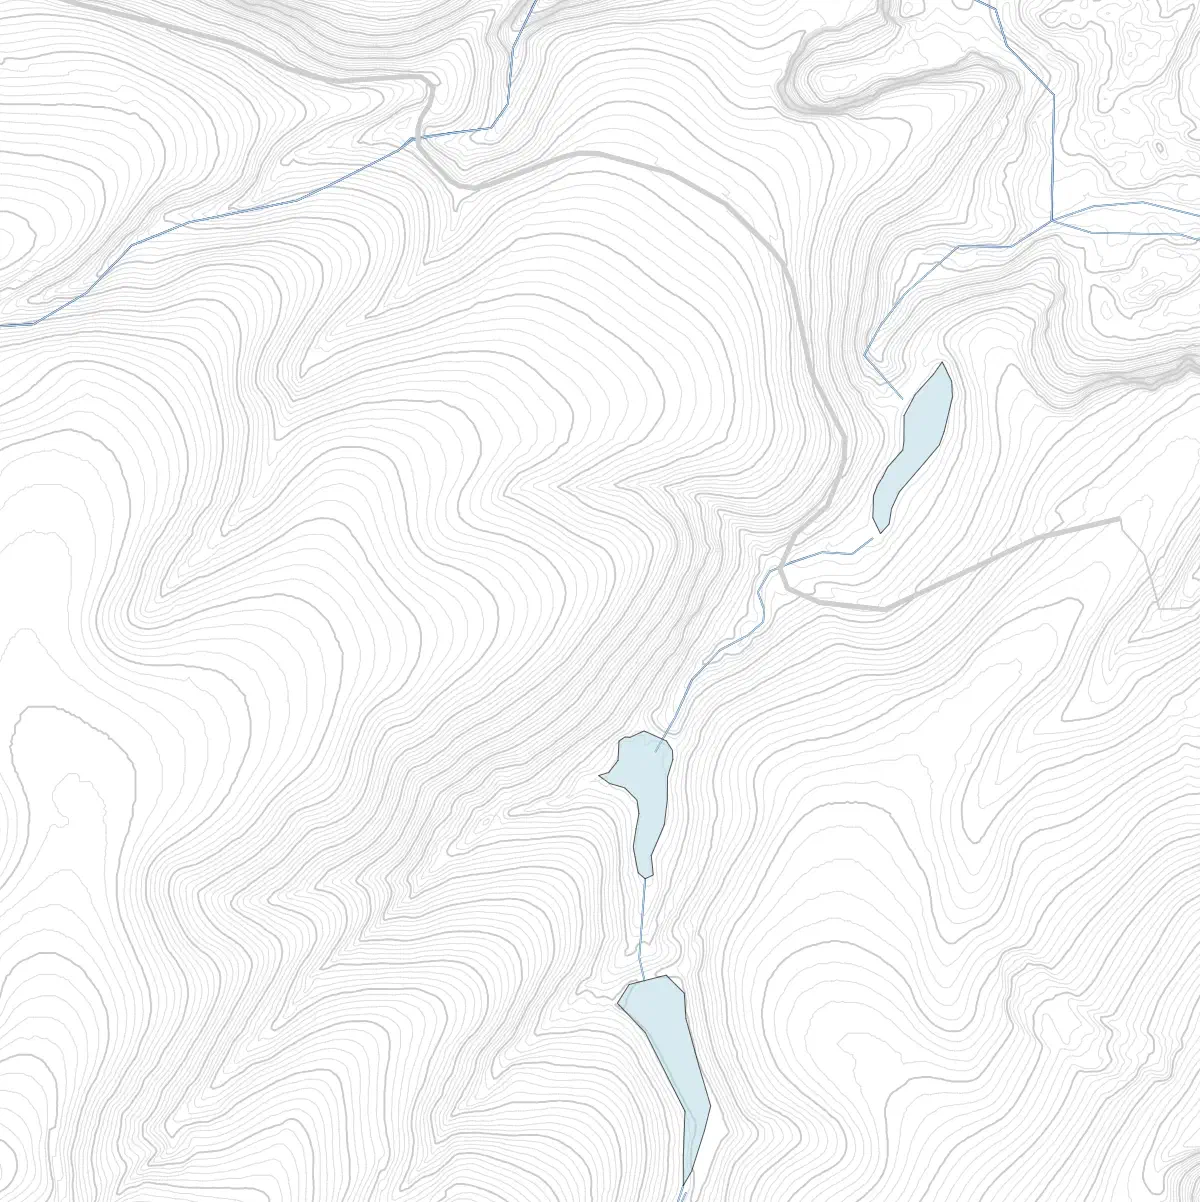
High-density 1-metre contour lines on 80 hectare property.
Step-by-Step: How to Generate Contour Maps in Permiehub
Serving as purpose-built mapping and ecological landscape design software for farms and ecological designers, Permiehub automates data retrieval and contour generation into a unified workflow inside the Base Map Wizard.
Step 1: Locating & Framing Your Property
Open your project in Permiehub and select the Base Map Wizard tool. In the search box, type your property address or locality.
Use the interactive map to zoom in and position the framing box directly over your property boundaries or watershed boundary.
Search for your address and position the frame over your project area.
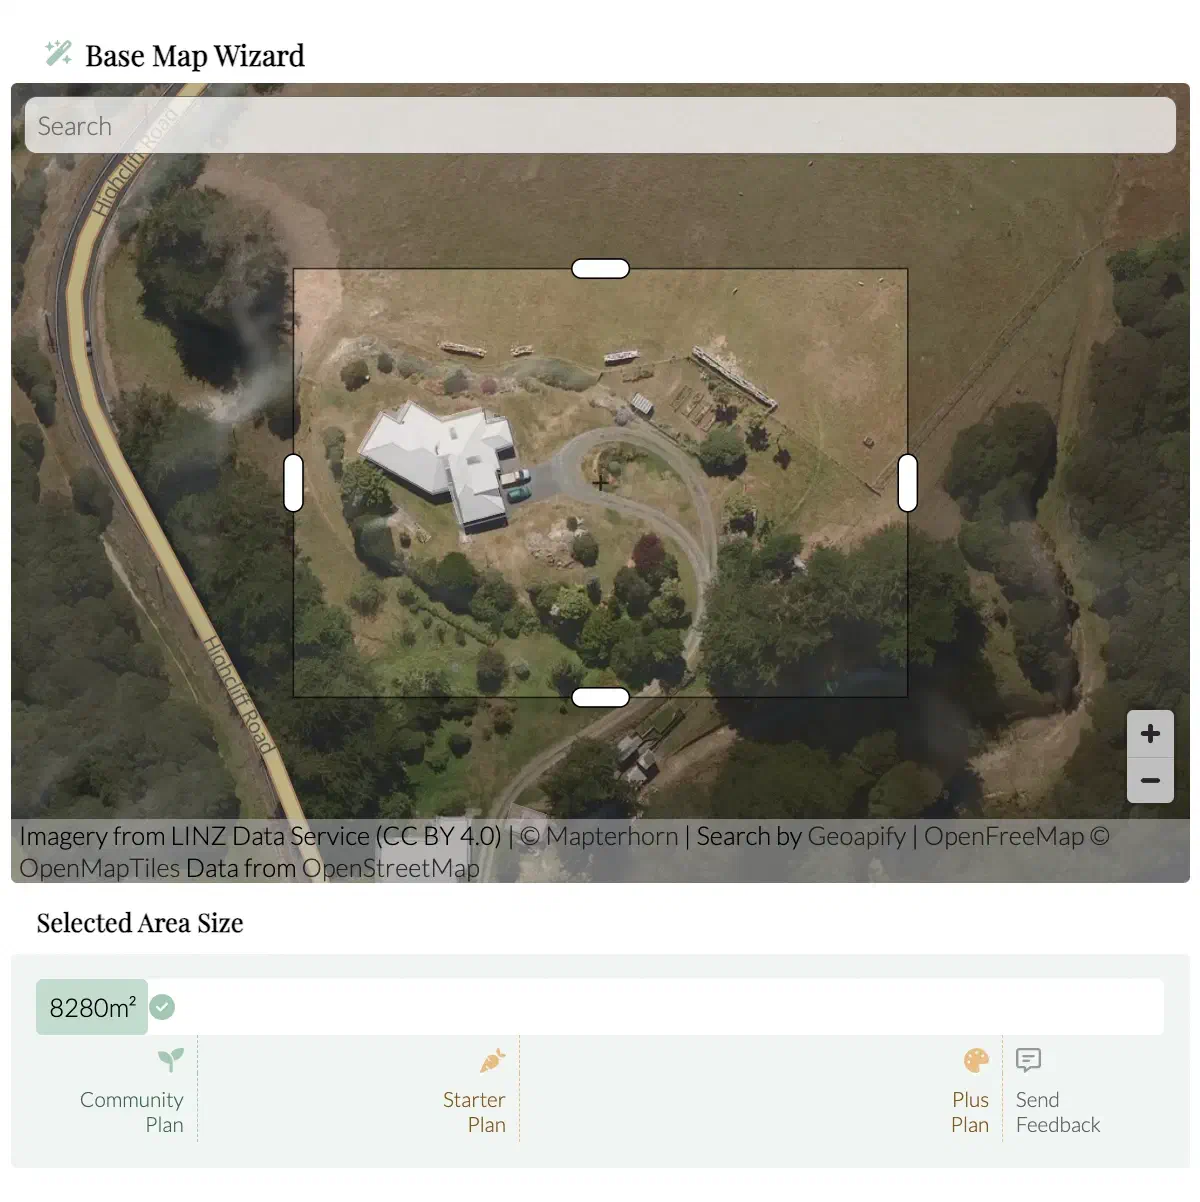
Adjust the selection box to import only the region you need.
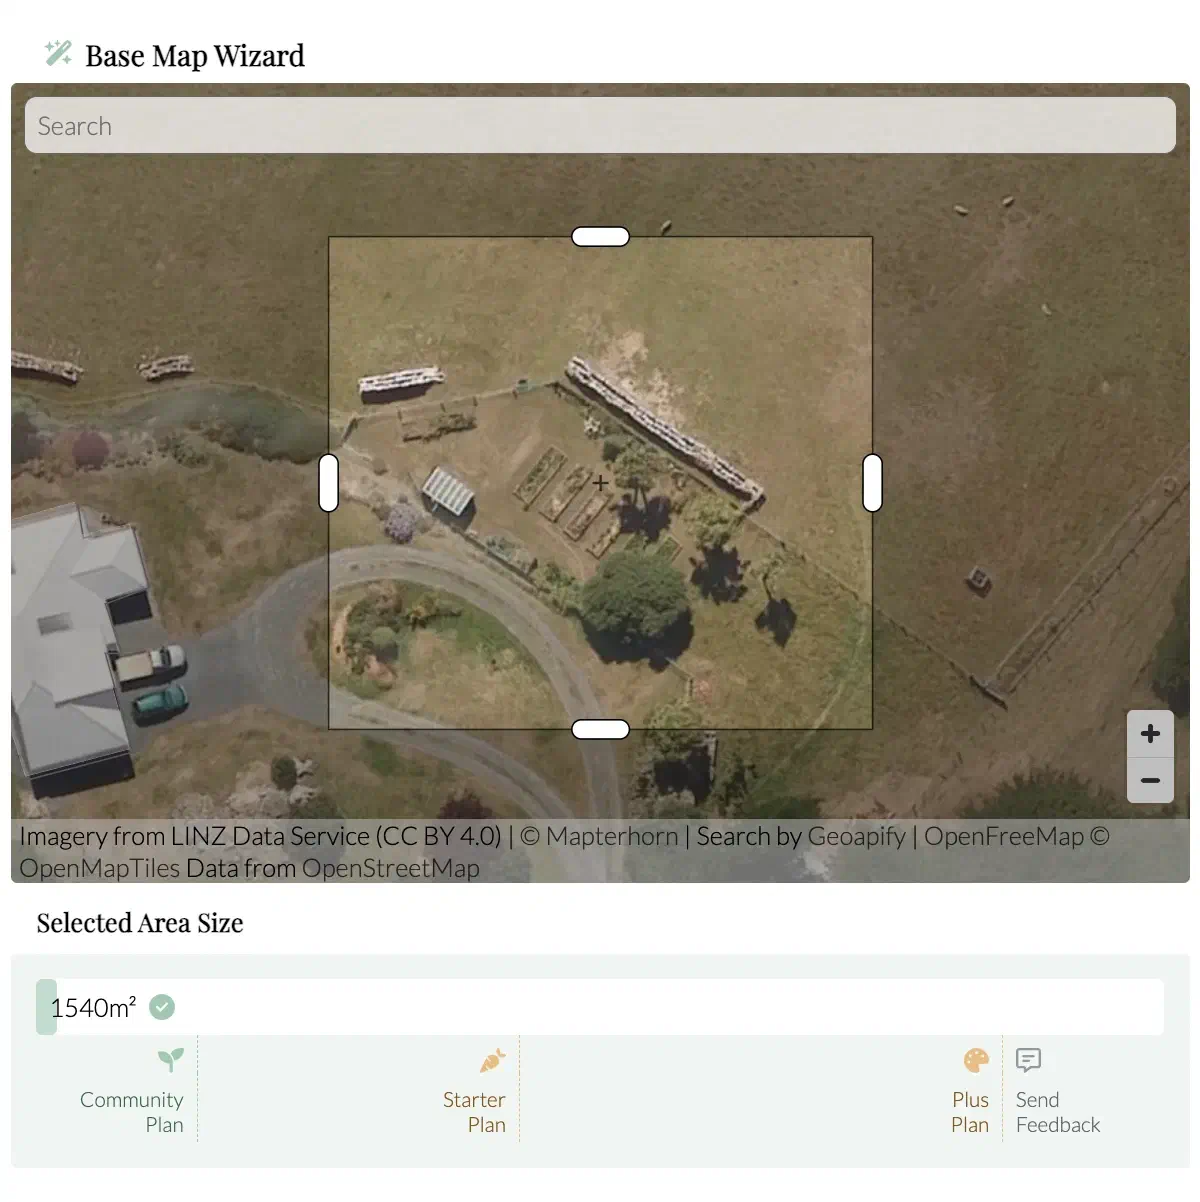
You can tighten the frame further for smaller design sites.
Step 2: Selecting Contour Interval and Layer Stack
Click Request Data. Permiehub queries available global and local datasets for your framed area.
In the configuration panel, you can adjust your Contour Interval to match the topography and scale of your property:
- 0.5m – 1m intervals: Ideal for homesteads, market gardens, and gentle slopes where subtle elevation changes guide swale placement.
- 2m – 5m intervals: Well-suited for broadacre farms and rural acreages.
- 10m – 20m intervals: Best for steep terrain to maintain a clean, readable canvas.
You can also toggle additional data layers to import simultaneously, including surface watercourses, building footprints, roads, power infrastructure, and high-resolution aerial imagery.
Step 3: Load Data into Project
Click Add to Project. Permiehub inserts all selected data directly on your canvas.
Your contours, creeks, building outlines, and aerial photography are scaled and aligned by default, completely eliminating the manual scaling errors common in generic drawing apps.
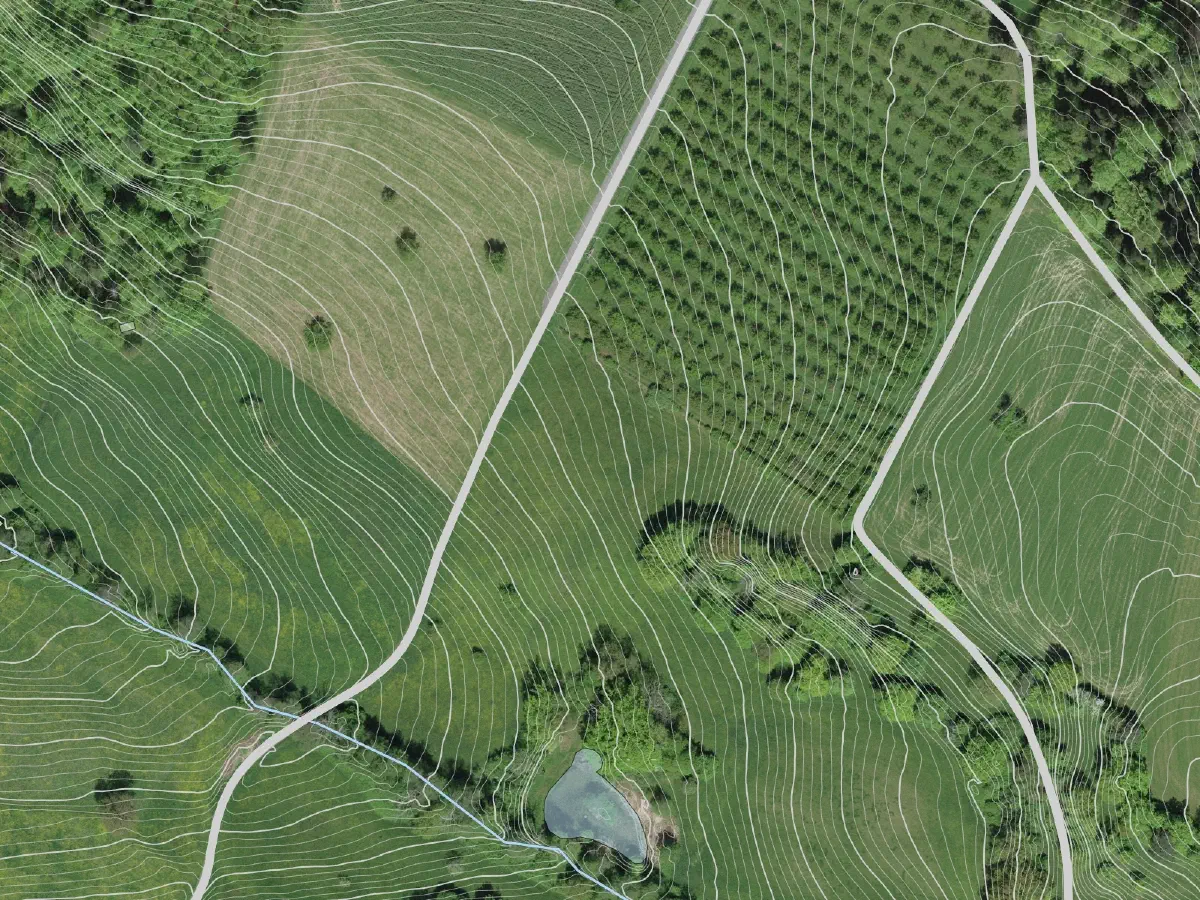
Switzerland: Scale-accurate contours, watercourses, and roads overlayed on swisstopo high-resolution imagery.
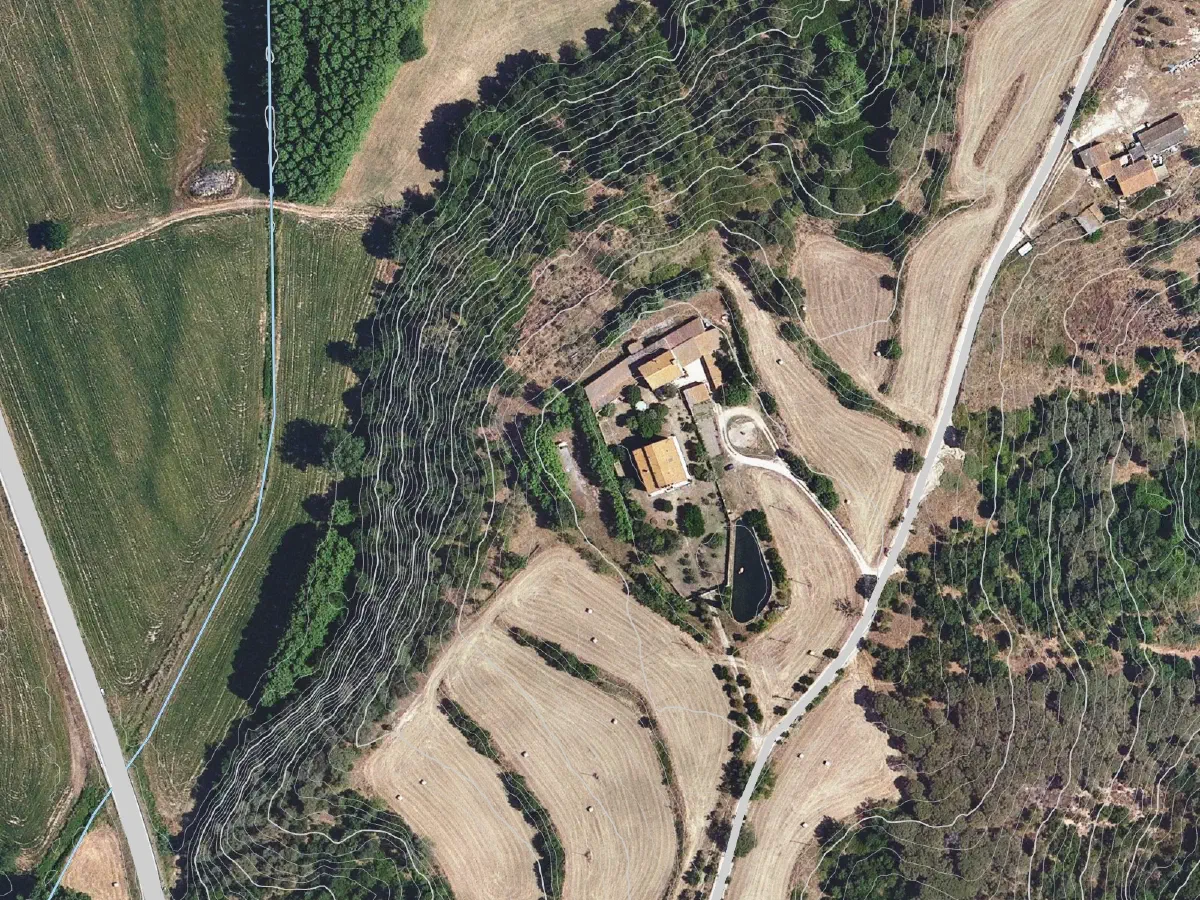
Spain: Contours and hydrography cleanly layered with PNOA aerial imagery.
New Zealand: Contours, roads, power lines and power poles overlayed on top of LINZ aerial imagery.
TIP
To learn more about dataset availability across North America, Europe, Australia, and New Zealand, check our Base Map Wizard Data Coverage.
Applying Contour Maps in On-Site Work & Field Design
Once your contour map is generated, it serves as the foundation for every phase of your ecological design process.
Digital Analysis on Canvas
With terrain data live in your project, you can:
- Overlay sun path & aspect: Visualise morning and afternoon solar angles across north-facing and south-facing slopes to identify microclimates.
- Design on-contour infrastructure: Utilise Permiehub’s specialised Planting Row tool to draw planting lines and swales along natural contours.
- Define functional zones: Group intensive kitchen gardens on accessible, level ground near dwellings while allocating steeper slopes to forestry or pasture.
Field Readiness & Ground-Truthing
Digital maps are most valuable when connected to real-world observations. Permiehub makes it seamless to take your topographic data outdoors:
- Scaled PDF exports: Export a high-resolution, scale-accurate printout, ready for clipboard sketching during site walks.
- Tablet & mobile field use: Open your project directly on a tablet or smartphone in the paddock to cross-reference digital contours with on-the-ground observations, wet spots, and existing vegetation.
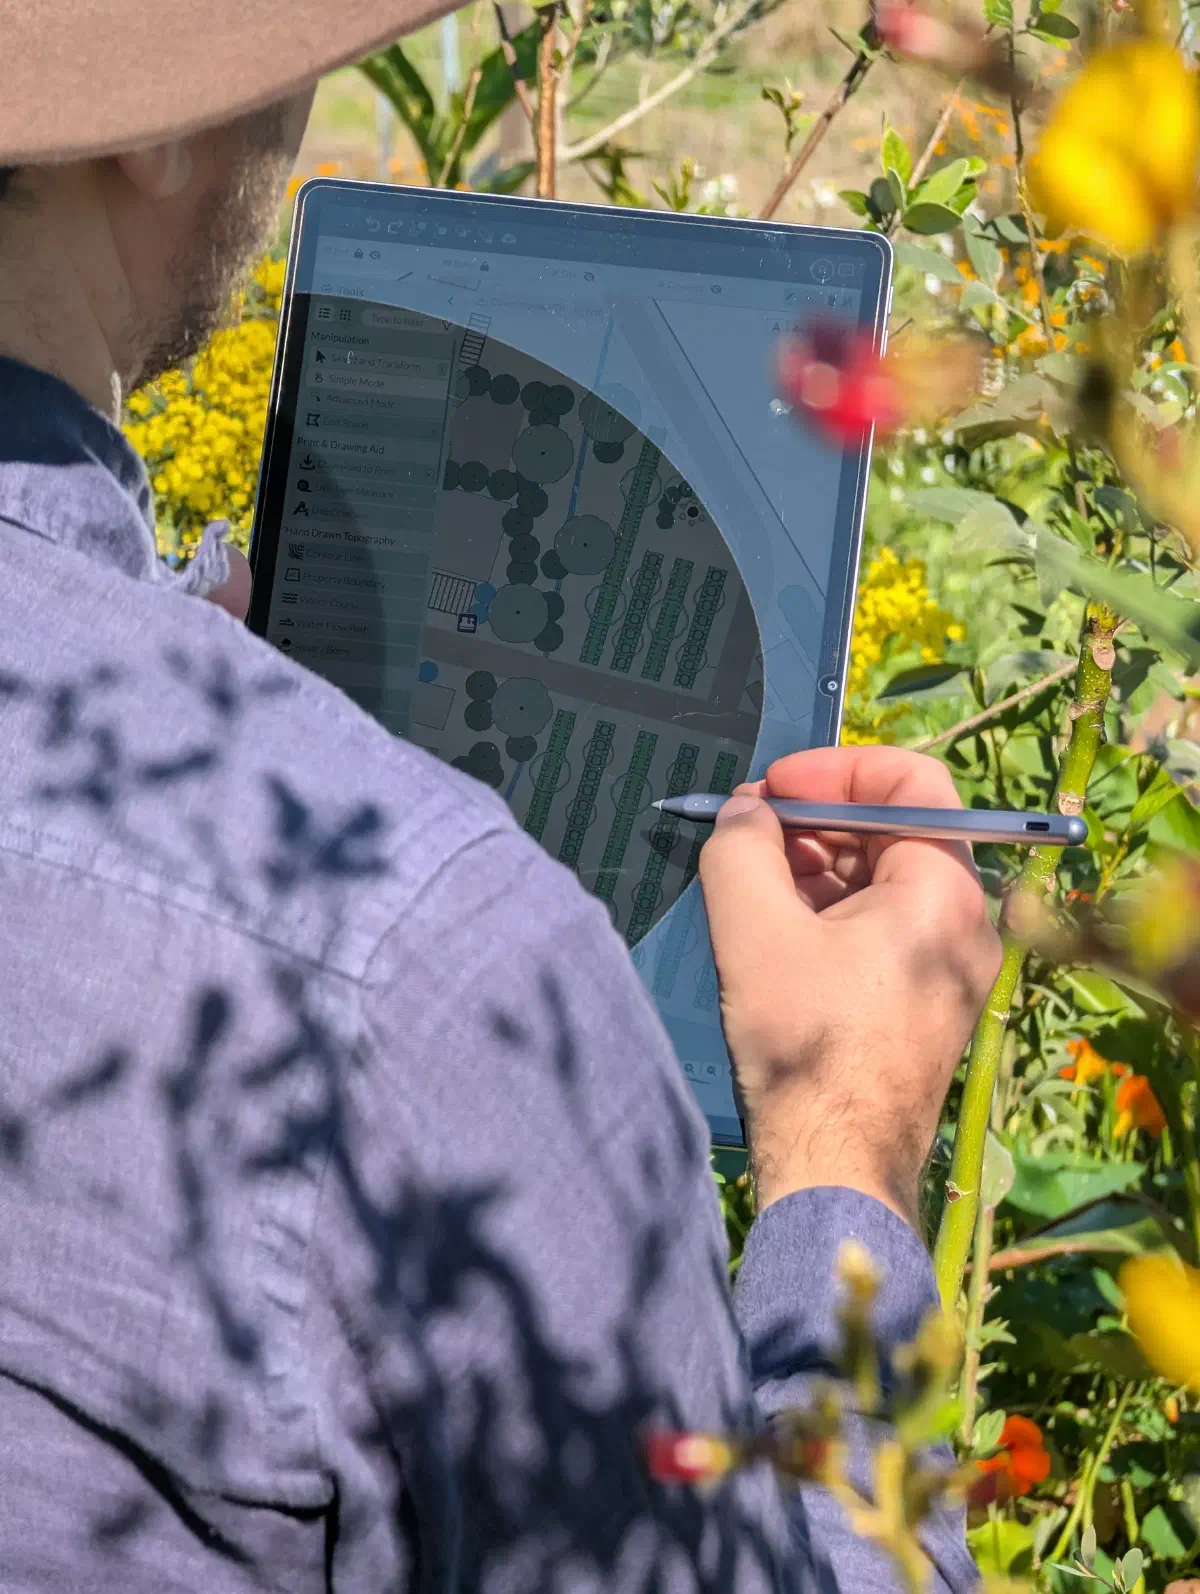
Using a tablet in the field for ground-truthing.
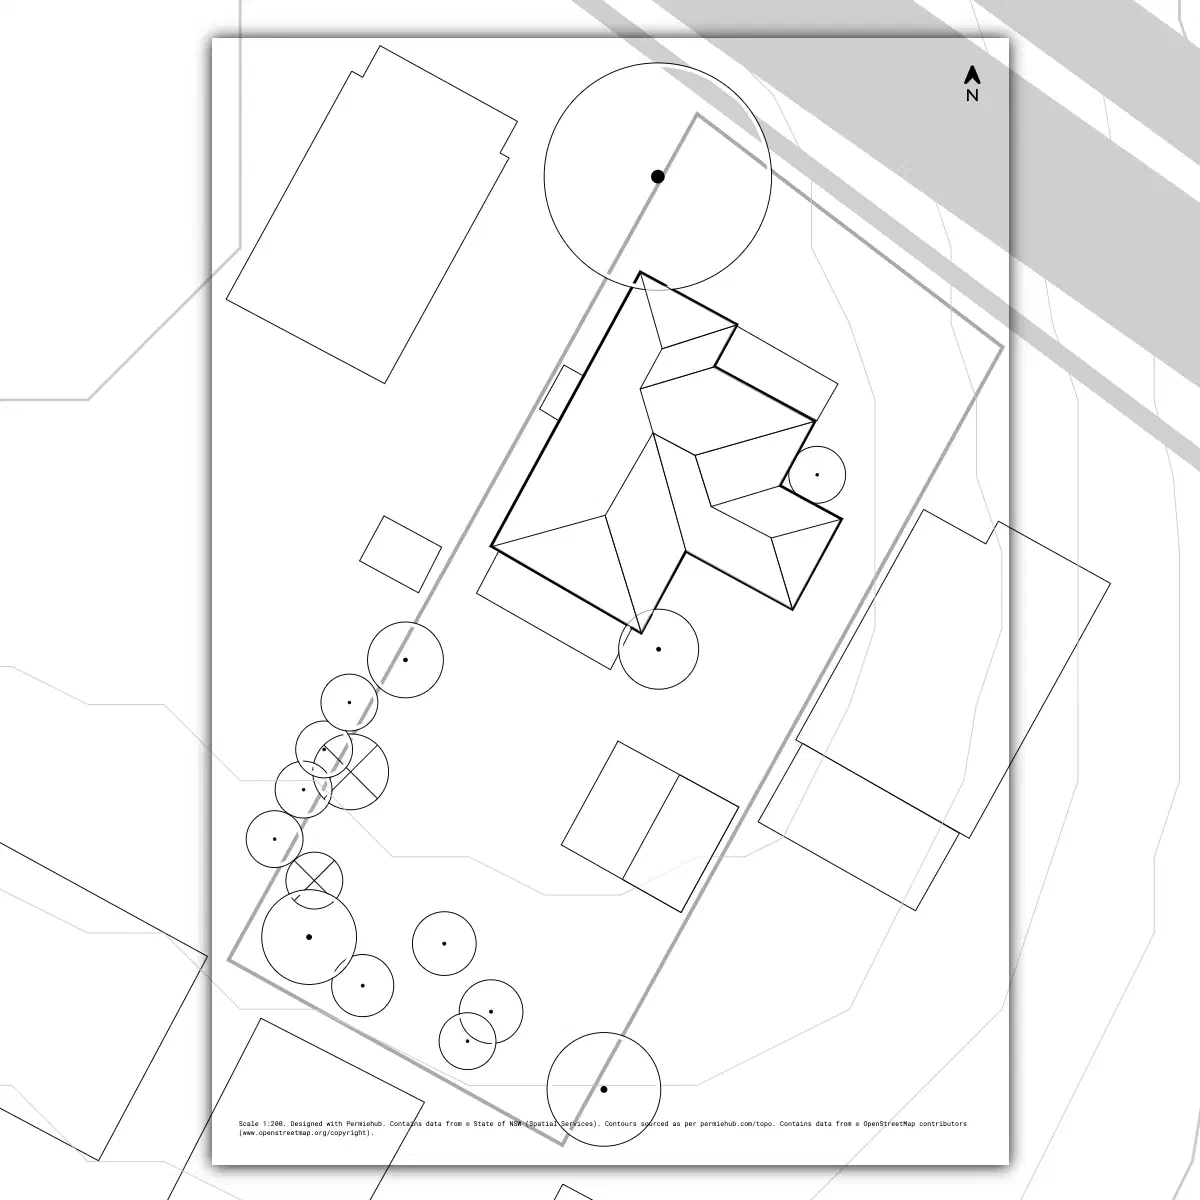
Framing a scaled selection area for high-resolution PDF export.
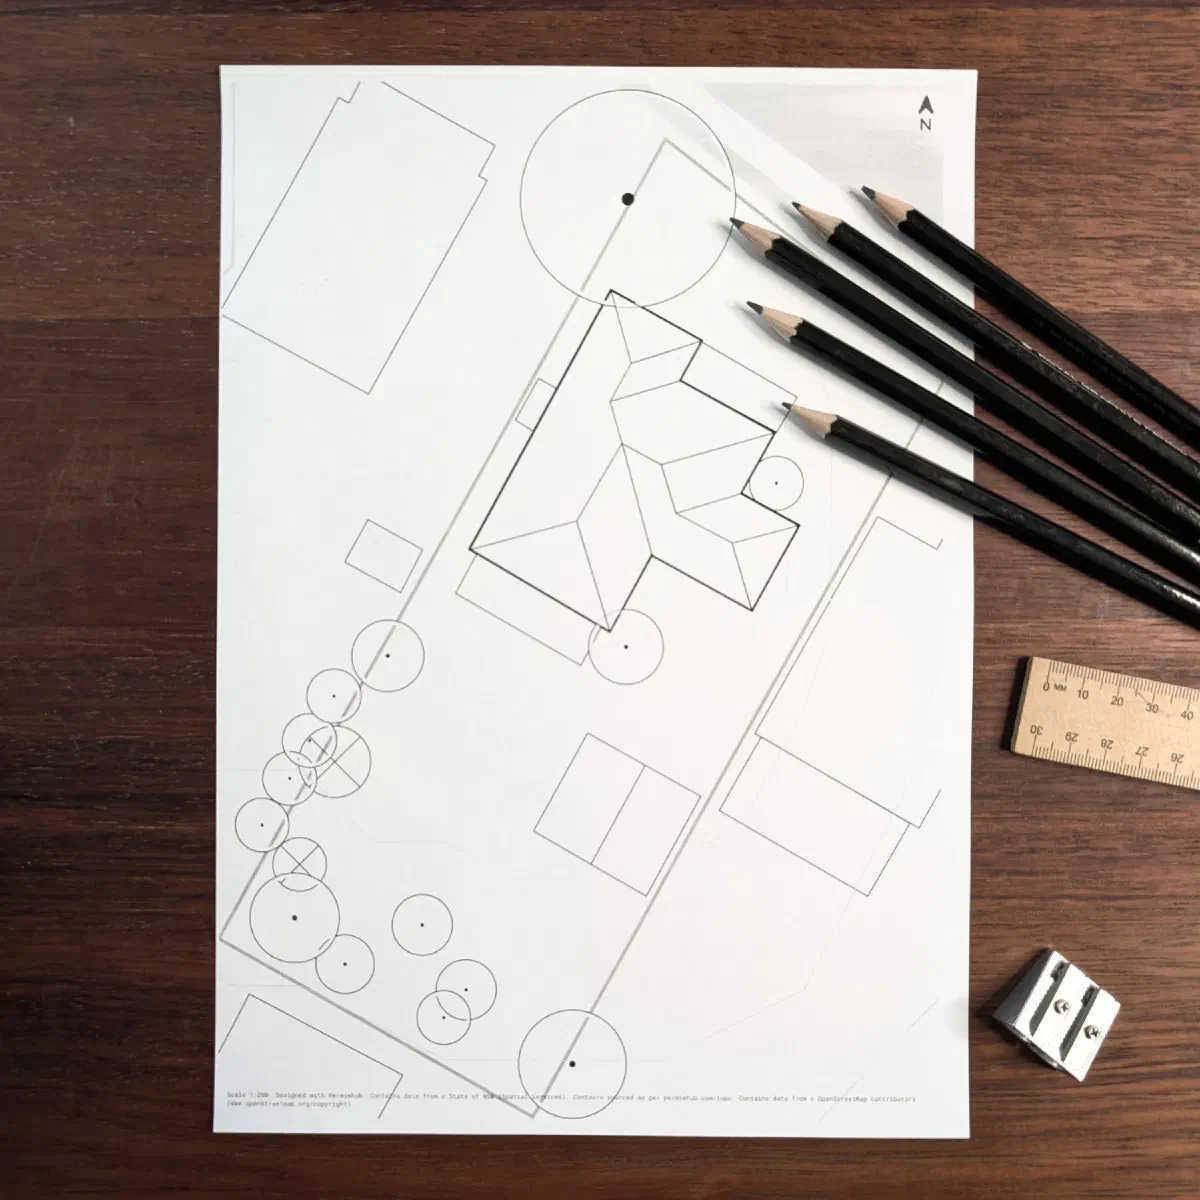
A scaled printout ready for hands-on field sketching.
TIP
Explore our guide on mapping land with manual field tools to learn how to combine digital contours with A-frames, water levels, and laser levels for precise ground-truthing.
Accelerate Your Land Design Workflow
Manually sourcing GIS elevation files and wrestling with drawing tools consumes hours that are better spent observing the landscape and refining your ecological design. By automating global elevation data extraction and combining contours with high-resolution aerial imagery and water bodies, Permiehub gives you a scale-accurate foundation in minutes.
Ready to generate topographic contours for your land?
Start Trial TodayFrequently Asked Questions
Traditionally, creating a contour map requires finding regional Digital Elevation Models (DEMs), downloading raster tiles from geospatial data portals, and extracting contour vectors in GIS software like QGIS. With Permiehub’s built-in Base Map Wizard, the process is automated: type your address, position the framing box over your land, choose your preferred contour interval, and click Add to Project to generate scale-accurate contours complete with aerial imagery and other data in seconds.
The ideal contour interval depends on property scale and slope:
- 0.5m to 1m intervals: Recommended for homesteads, Zone 1 to 2 gardens, and gentle slopes where subtle elevation changes guide minor earthworks, garden beds, and swale placement.
- 2m to 5m intervals: Best for broadacre farms and hilly terrain, providing enough elevation detail for site planning while keeping the map clear.
- 10m to 20m intervals: Suited to steep terrain to prevent contour lines from crowding the map.
Contour lines in Permiehub are derived from curated open digital elevation models, including global radar missions (such as Copernicus DEM and NASA SRTM) and government airborne LiDAR surveys (from agencies like USGS, Geoscience Australia, LINZ in New Zealand, and European mapping authorities) compiled through the Mapterhorn project. This data provides global coverage, making it ideal for landscape planning, surface hydrology, and sector analysis.
Yes. Permiehub handles data retrieval, projection, and vector generation automatically for you, eliminating the technical overhead of using GIS software while preserving scale-accurate dimensions.
Contour lines connect points of equal elevation above sea level, and surface water always flows perpendicular to these lines. By identifying contours, designers can position on-contour swales that slow, spread, and sink rainwater into the landscape. Doing so helps prevent topsoil erosion, recharge groundwater, and locate ridges and valleys for keyline water distribution.
Yes. Permiehub runs in modern web browsers across desktops, tablets, and smartphones, allowing you to carry your digital contours into the paddock for ground-truthing. You can also export high-resolution, scale-accurate PDFs to use on clipboards during site walks.
Related Guides & Resources
Continue exploring how to build and utilise accurate landscape maps:
- Step-by-Step Base Map Guide — Learn how to trace permanent structures and map existing trees.
- Base Map Wizard Data Coverage — Explore global datasets and supported high-resolution aerial imagery regions.
- Mapping Land with Manual & Digital Tools — A comprehensive guide to understanding slope, measuring height differences, and field surveying.
- Mapping Your Property with a Consumer Drone — How to capture and upload custom drone orthophotos into Permiehub.
- Drawing Planting Rows — Learn how to draw planting rows for guilds, orchards, food forests, and syntropic agroforestry rows, and planting nests in Permiehub.